Remarks by Vitor Gaspar at the launch of “Fiscal Policy and Long-Term Growth”
July 1, 2015
Peterson Institute for International Economics
June 30, 2015
Many thanks to the Peterson Institute for hosting this event. Special thanks to Adam and Doug for joining the debate. Thanks to all for participating.
Today I will present a recent study by the IMF’s Fiscal Affairs Department (FAD) that explores how fiscal policy affects medium- to long-term growth.
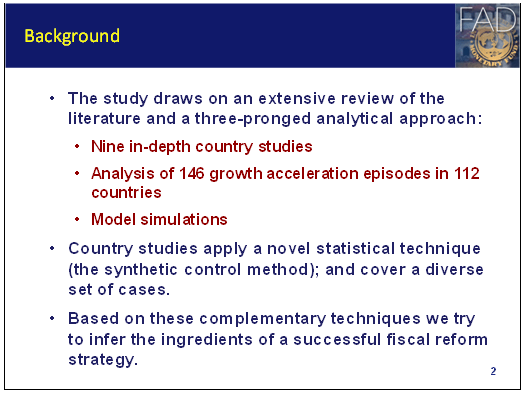
In our study, we distill lessons on growth-friendly reform options based on an extensive review of the literature and three complementary analytical approaches:
First, we examined 12 case studies of successful fiscal reform across 9 advanced, emerging and low-income economies;
Second, we explored the empirical link between major fiscal reform episodes and what we define as “growth accelerations”;
Third, we performed simulations of an endogenous growth model. Results from these simulations will not figure in my presentation today.
The case studies employ a novel statistical technique: the synthetic control method. This represents an important methodological innovation. I will come back to this later.
Based on these three complementary approaches, we infer the main principles and elements for successful fiscal reform.
Let me start by explaining why we focused on analyzing options for growth-friendly fiscal policies at this point in time.
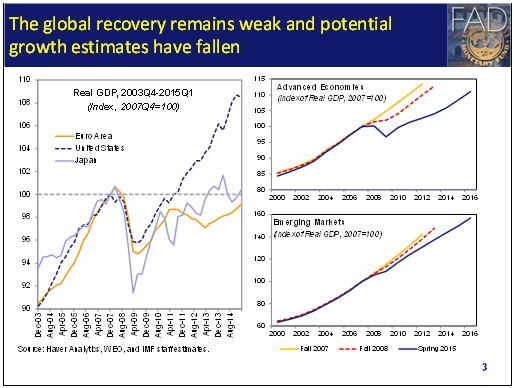
The global recovery remains weak, as is clear from the chart on the left.
Further, the charts on the right show that the global crisis has affected more than current economic activity. Prospects going forward have also dimmed.
Restoring robust growth is a key policy priority. Fiscal policy instruments can play a central role in supporting strong and equitable growth.
Does fiscal policy affect long-term growth? If so, how? Let me start with the macro level, and specifically the impact of fiscal stabilization on growth.
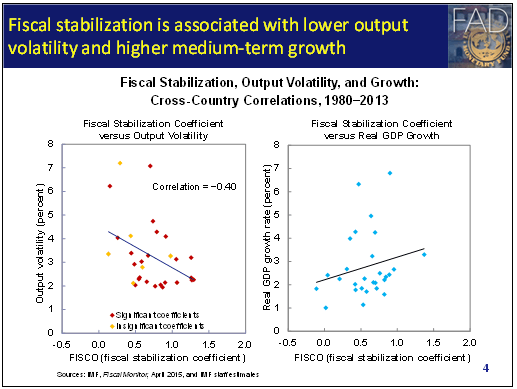
To measure whether fiscal policy contributes to macroeconomic stability, the April 2015 Fiscal Monitor introduced the concept of the fiscal stabilization coefficient; what we call “FISCO”. FISCO measures how much a country’s overall budget balance changes in response to a change in the output gap.
In other words, if FISCO is equal to 1, it means that when output falls below potential by 1% of GDP, the overall balance worsens by the same percentage of GDP. The higher the FISCO, the more counter-cyclical or stabilizing is the conduct of fiscal policy.
In the left chart, we can see that a higher FISCO is associated with lower output volatility.
Why is this important? First, because lower macroeconomic volatility helps avoid wasteful fluctuations in employment and growth. Second, because lower macroeconomic uncertainty provides a favorable environment for investment in physical and social capital, thereby boosting medium-term growth.
This link between FISCO and growth is illustrated in the figure on the right.
The effect of raising FISCO can be large.
Take, for example, the case of an advanced economy that raises its FISCO from the median level (0.7) to that in the top third of countries (about 0.8). This would reduce output volatility by about 15 percent, and in turn bring about a growth dividend of 0.3 percentage points annually.
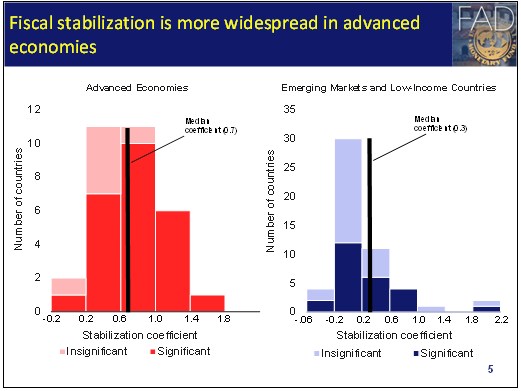
As you can see in the charts, fiscal stabilization appears to be higher among advanced economies than among emerging markets and low-income countries. The median FISCO among advanced economies is 0.7; and only 0.3 among emerging market and developing economies.
In our estimation, we attempt to address some of the well-known challenges with growth regressions identified in the economic literature. Still, as with all econometric findings, these results must be interpreted with caution.
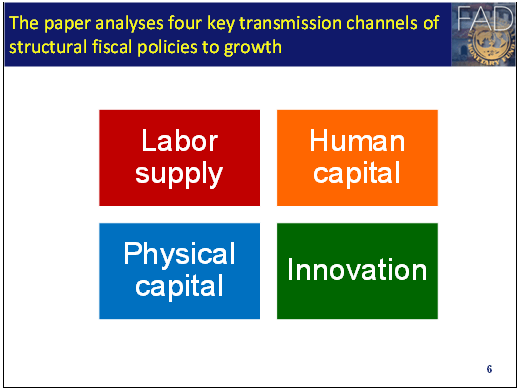
Turning now to the micro level, we see four main transmission channels at work between structural fiscal policies and growth: labor supply, physical capital stock, human capital, and last but not least, innovation.
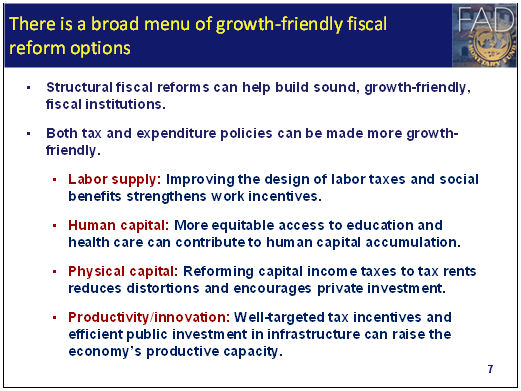
Both tax and expenditure policies can be used to increase growth through these four channels.
This was examined in much detail in our study. Here I will only focus on three examples.
Let me start with expenditure.
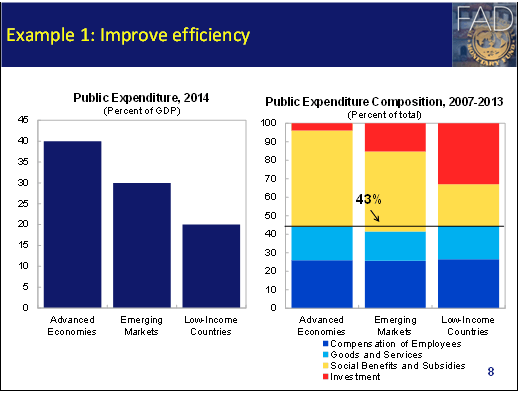
As you can see on the left chart, total spending in advanced economies reached more than 40 percent of GDP in 2014. This figure is just above 30 percent of GDP for emerging market economies and 20 percent of GDP for low-income countries.
As you can see in the chart on the right, across all country groups, compensation of employees plus goods and services fall within a narrow range of 42-44 % of expenditures.
Subsidies and social benefits account for more than half of total spending in advanced economies, and more than 40 percent of spending in emerging markets. In contrast, in low income countries, they account for less than 25 per cent of expenditures, and around 5 per cent of GDP.
This highlights the areas that could be examined to achieve greater efficiencies in various country groupings.
For example, the government wage bill could be reduced where public sector wages and employment are high relative to the private sector.
Social spending could be reviewed where it is poorly targeted. For instance, in advanced economies, only one-fifth of total spending on family benefits was means-tested in 2011.
Also, improvements in the efficiency of public investment should be pursued, especially in low-income countries.
Let me turn to taxes.
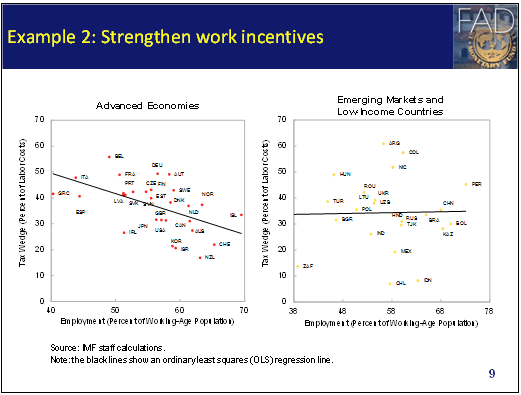
The figure on the left shows that in advanced economies the labor tax wedge is negatively correlated with employment.
Reducing the tax wedge, especially when it is high, strengthens work incentives and can lead to higher employment.
Country studies in our paper show that labor tax cuts were used to boost labor participation, including in Ireland and the Netherlands. For instance, in Ireland, labor taxes were cut substantially in the context of a social partnership agreement. This contributed to a strong increase in labor force participation and a noticeably higher contribution of labor to total economic growth.
In developing economies there is no clear relationship, as you can see in the chart on the right. This is mainly due to smaller social safety nets and the narrower revenue base of direct taxes.
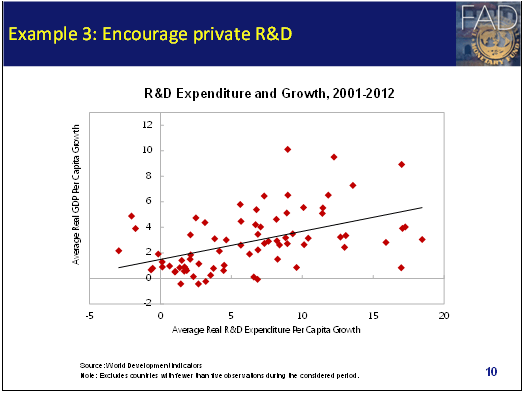
My third example has to do with innovation. This chart illustrates the positive relationship between spending on R&D and long-term growth.
However, R&D tax incentives must be designed very carefully to avoid distortions and ensure their effectiveness.

What happened in countries that undertook fiscal reforms?
Our study examines 12 significant fiscal reform episodes in 9 countries to assess their long-run impact on growth.
As I mentioned earlier, these studies are based on an innovative statistical technique, the synthetic control method.
Put in simple terms, the approach calculates what would have been the growth path of a country had policy reforms NOT been implemented. This is called the synthetic growth path.
We then compare the actual growth path of the country to its synthetic growth path to assess the potential impact of the reforms.
As you can see in the left chart, the growth gains for the most part are significant. In advanced countries, long-term growth is about 0.7 percentage points higher than the synthetic projection would suggest.
We also find that the channels through which fiscal reforms affected long-term growth were related to the specific reform actions taken. For example, the contribution of labor in output growth increased in countries that implemented an overhaul of labor taxation and reduced the tax wedge. This was the case of reforms in Chile and the Netherlands.
However, we have to be careful in interpreting these results. It is difficult to fully disentangle the impact of fiscal reforms from the impact that other accompanying reforms may have had, even if our methodology aims to control for such factors.

The second piece of evidence I wanted to share is the analysis of growth accelerations and fiscal reforms.
The methodology involves identifying episodes where fiscal reform was followed by growth accelerations. We define growth acceleration as a durable increase in five-year average growth of at least one percentage point.
Our results indicate that the probability of growth acceleration seems to be higher in the presence of previous fiscal reforms:
On the expenditure side, increases in health, education, and infrastructure spending were followed by growth accelerations in up to 40 percent of all cases.
On the revenue side, reductions in the share of income taxes matched by an increase in the share of indirect taxes were followed by growth accelerations in 35-40 percent of all cases.
When revenue and expenditure reform were combined, growth accelerations ensued in close to 60 percent of the cases.
This leads me to another set of important lessons we took away from our in-depth analysis. Reform design matters. Four lessons stand out:
First, successful fiscal reform episodes tend to be characterized by mutually reinforcing fiscal measures.
Second, successful fiscal reform episodes tend to be characterized by coterminous and complementary structural reforms.
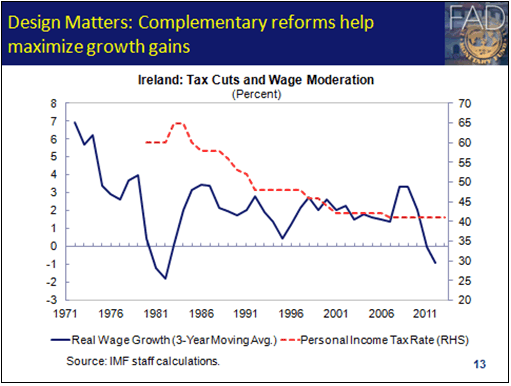
For example, in Ireland in the late 1980s, wage moderation was important to restore competitiveness and create jobs. The road to real wage growth reductions was paved by personal income tax cuts that mitigated the impact on disposable income. And tax cuts were made possible by expenditure-based fiscal adjustment.
This episode also highlights our third lesson: public support for reform is key. In particular, compensatory measures for those expected to lose from reforms have been found to be effective in implementing and sustaining reform efforts. In the Irish example, tax cuts made lower gross wages more palatable.

Here is another example of the role of public support. This chart shows that public wage bill reductions involving social dialogue were typically larger and more sustained than otherwise.
Effective communication with stakeholders can also help foster support for reforms.
In our country sample, there was a strong focus on building consensus to pave the way for politically unpopular measures. Social partnerships were crucial in Australia, Germany and the Netherlands. In Poland, comprehensive reform of the pension and tax systems was only possible after building political consensus forged around the common goal of joining the EU.
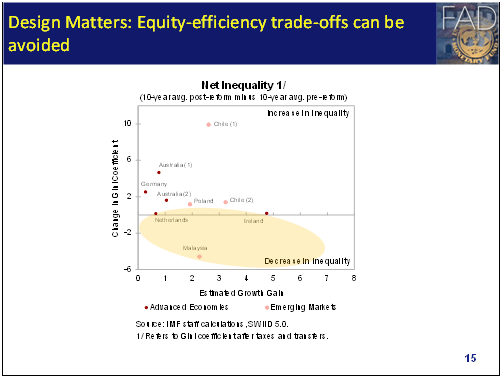
The fourth and final lesson of reform design is equity. Balancing efficiency and equity considerations is critical.
Some reforms that increase efficiency may have adverse distributional consequences. However, if appropriately designed, fiscal reform packages can serve both growth and equity objectives. This is supported by evidence from our country case studies:
For example, in Ireland in the late 1980s, income inequality did not increase significantly and growth accelerated despite a sharp reduction in public spending. This partly reflects the design of fiscal policies. Cuts in public sector wages and untargeted transfers turned out to be progressive. They created room for tax reductions that facilitated a sharp increase in job-creation and employment after the reforms.
In Malaysia, measures that helped reduce inequality included the public provision of health and education services; a system of targeted transfers; and training to facilitate mobility from agriculture to higher value-added activities.
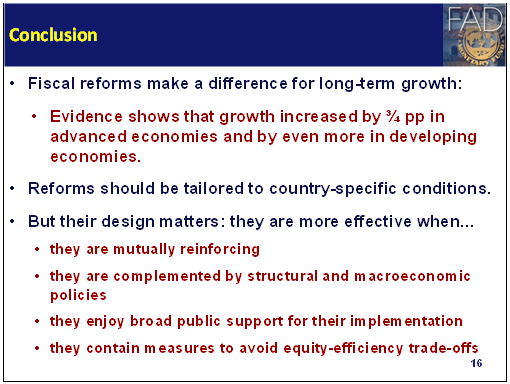
To summarize, fiscal policy can make a significant difference in supporting strong and equitable growth.
As I illustrated earlier, our estimates show that average annual growth in advanced economies might have increased by ¾ percent of GDP after the implementation of reforms.
While I would love to share with you the “magic” list of measures that will help countries grow, in reality there is no one-size-fits-all. Fiscal policy reforms need to be tailored to country-specific conditions, administrative capacities, and preferences.
What I can say, however, is that the growth dividends and sustainability of fiscal reforms depend to a large degree on their design.
Successful fiscal reforms exploit policy complementarities. They are generally accompanied by structural reforms and supportive macroeconomic policies;
Social consensus increases the likelihood of reforms being implemented and sustained; and
Both growth and equity objectives can be achieved if reforms are designed well.
Thank you!
IMF COMMUNICATIONS DEPARTMENT
| Public Affairs | Media Relations | |||
|---|---|---|---|---|
| E-mail: | publicaffairs@imf.org | E-mail: | media@imf.org | |
| Fax: | 202-623-6220 | Phone: | 202-623-7100 | |


