Mountains of debt: the Cliffs, Slopes and Uncharted Territories of Today’s Public Finances in Advanced Economies
February 18, 2013
Boston College, February 18, 2013
Thank you very much for inviting me here. Today, as the title of my presentation suggests, I will give you a guided tour of the land of public debt in advanced economies. It is not a pretty land. The fiscal accounts of many advanced countries are in their weakest state since… well one could say they have never been so bad. By the same token, it is a land that is not well known (we have never been there) and the risks in crossing it are difficult to evaluate. And, of course, in giving you this guided tour, I will also present the views of the IMF on how best to cross this dangerously unchartered territory.
Let me start with what happened in 2008. Some may recall 2008 as the year when Lehman collapsed; others as the year of the largest drop in the Dow Jones since the 1930s. But there was an even more unusual event: the IMF, for the first time in its history, called for a global fiscal expansion across all countries that could afford it. It had never happened before. Monetary policy had been seen as the tool to respond to a deceleration in economic activity, not fiscal policy.
This change of view about the role of fiscal policy reflected three considerations:
- First, it was felt that the magnitude of the shock to the world economy was so large that things could get out of control: it was not an ordinary recession.
- Second, we felt that, while the recession originated in a house price boom and financial sector misbehavior, it had turned into a demand recession: lack of demand, caused by uncertainty and rising unemployment, was driving output further and further down. In other words, Keynes’ General Theory was the relevant textbook.
- And, third, with credit markets not working, the monetary lever was not working either: even at zero interest rates the private sector would not borrow.
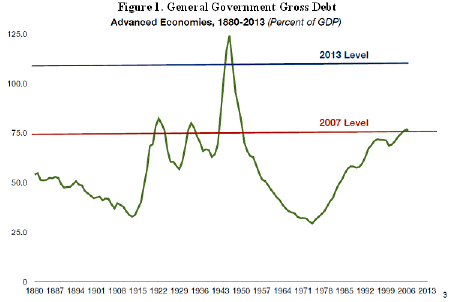
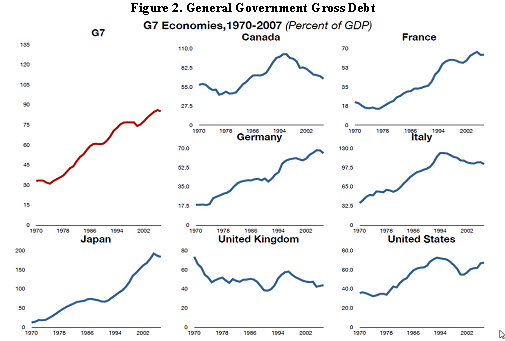
We called for a fiscal expansion in spite of the fact that the state of public finances in 2007 was not particularly good by historical standards. Already in 2007 the public debt to GDP ratio in advanced economies was at a historical peak (Figure 1) as a result of a trend increase that, since the mid-1970s, had involved all the major advanced economies, except U.K. and Canada (Figure 2). And yet we felt the risks of a great depression were too large and justified a bold fiscal action.
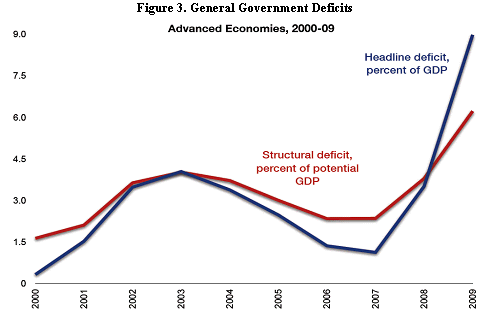
In these conditions, deficits rose rapidly both in headline and cyclically adjusted terms (Figure 3). Note that the deterioration of the cyclically adjusted deficit between 2007 and 2009, at about 4 percentage points of GDP, was larger than the discretionary fiscal stimulus (about 2 percentage points), because, in our calculations, we assume that potential output declined as a result of the crisis and that, consequently, there was a loss of revenues that, while structural, was not due to discretionary actions. This is important to keep in mind as some, like Krugman, argue that the loss of potential output was not large, and therefore, the deterioration of the structural deficit was not as large, as revenues will come back.
As deficits increased and GDP declined, the average public debt ratio surged, and is projected at over 110 percent of GDP at end-2013, not too far away from the World War 2 historical record. However, four factors make the current situations even more difficult than after World War 2 (Figure 4):
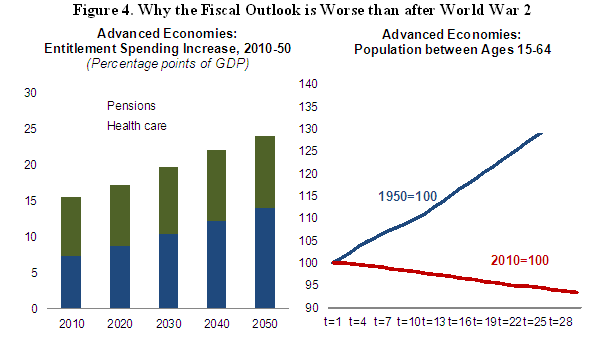
- First, most of the fiscal adjustment then consisted of cuts in military spending, with a negative macroeconomic impact but with low political cost
- Second, there was no pressure on pension and health care spending at the horizon. Now we project pension and health care spending to rise on average by several percentage points of GDP over the coming decades. Part of this is due to population aging, which brings me to the next difference
- In the 1950s the labor force was rising rapidly; now it is projected to fall, with implications for output and revenue growth
- And finally, the financial sector in most advanced economies was repressed, for example with interest rate controls and investment requirements in government paper, which made it easier to finance public debt.
Things, unfortunately, are much weaker at present across these four dimensions.
So far, I have presented data about averages, but it is important to look beyond averages as the situation is really different across advanced economies. We can classify advanced economies in three groups (Figure 5).

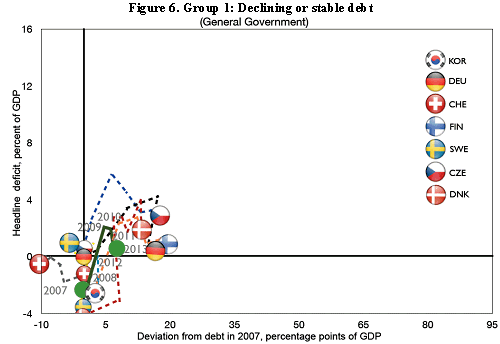
The first includes countries that already managed to stop the rise in public debt. In Figure 6 you will see on the vertical axis the level of the deficit and on the horizontal axis the change in the debt ratio with respect to 2007. The average balance for this country group was in surplus in 2007. This balance moves into a small deficit in 2009; debt increases, but then already in 2011 things are brought under control. As to individual countries, Sweden and Switzerland are the best performers.
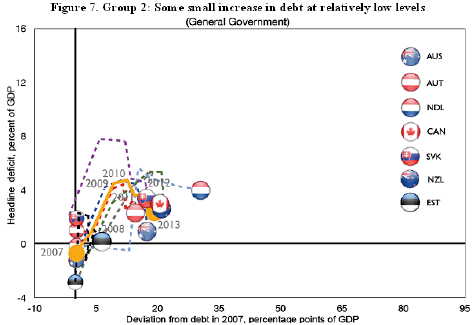
The second group includes countries with fiscal accounts that are also in a fairly good shape. Debt ratios have increased in 2012 but at relatively low levels, and the projected increase for 2013 is fairly small (Figure 7).
The third group includes ten countries where fiscal pressures are most severe (Figure 8).
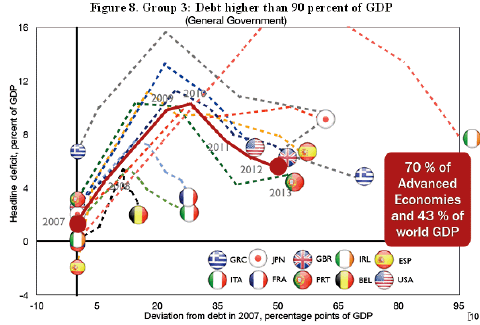
These countries started the crisis with weaker fiscal positions, suffered a larger deterioration in their deficit, which started declining only in 2011, but not enough to stop the increase in public debt. All countries in this group have debt ratios higher than 90 percent of GDP. So, when we talk about fiscal problems in advanced economies we are talking primarily about these ten countries. The good news is that the number is not very large. The bad news is that these countries represent 70 percent of advanced economies GDP and 43 percent of world GDP.
In evaluating the difficulty of implementing fiscal adjustment in the coming years, we will have to focus on these 10 countries.
How difficult will it be for these countries to bring the fiscal accounts under control over the medium term? It depends on two things. First, is what we mean by “bringing public finances under control,” second, on the assumption we make about interest rates and growth.
Regarding the first question, what we mean by “bringing public finances under control,” stabilizing the debt to GDP ratio at the currently high levels would in principle be consistent with maintaining fiscal solvency: as long as the debt ratio is stable (and assuming a positive interest rate –growth differential) the government’s inter temporal budget constraint—or equivalently the No-Ponzi game condition—would be met.
However, there are two good reasons not to aim at such a modest target:
First, stabilizing public debt at the current level would leave countries exposed to confidence shocks, given possible doubts about the ability to raise the primary surplus further from an already high level.
Second, there is evidence that high public debt, at least behind a threshold of 80-90 percent, lowers potential growth by about 0.2 percent every 10 percentage point of GDP.1
So, the goal of the strategy should be to lower the debt ratio over time to at least below 80 percent. How long will it take? How high should the primary balance be? A lot depends on the assumption on interest rates and growth. The interest rate on public debt affects the speed at which debt accumulates. The growth rate of GDP affects the denominator of the public debt to GDP ratio. Both therefore affect the dynamics of the debt to GDP ratio.
Historically, in advanced economies, the debt to GDP ratio has averaged 1¼ percent in the twenty years preceding the crisis (Figure 9). It has trended downwards during this period, perhaps reflecting increasing savings coming from emerging economies, which has contributed to lowering interest rates in the pre-crisis years. With the crisis, the average differential has edged up but remains below the historical average.
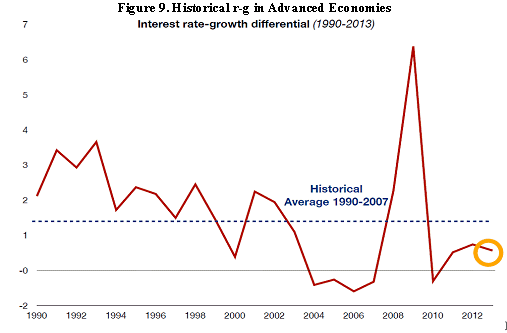
What will happen in the future? In principle, there is clear econometric evidence that interest rates are positively affected by the level of public debt (with 10 percentage points more of debt raising interest rates by some 30-40 basis points), while, as I said, the growth rate is negatively affected. So we should expect the differential to be higher than before the crisis. But the uncertainty around these point estimates is large. Moreover, various factors affect interest rates, such as the composition of the investors, base and the credibility of the fiscal strategy.
It makes sense therefore to run some sensitivity tests around any baseline assumption. In what follows I will show you some illustrative adjustment scenarios in which the goal is to lower the debt to GDP ratio to a certain threshold by 2030, starting with what we project now will be the deficit in 2013. Figure 10, for example, shows the case of the U.K. We assume in these scenarios that the cyclically adjusted primary balance, that is the balance net of interest payments, adjusted for the effects of the economic cycle, reaches its required level by 2020, and then stays there for another 10 years so as to reach the debt target of 60 percent by 2030. Two things are relevant in assessing the difficulty of implementing these adjustments: the further improvement in the primary balance needed by 2030 and the level of the primary balance following 2020. In this case, the U.K. would have to improve its primary balance by another 4½-5 percent and maintain a surplus of about 4 percent for the following years.
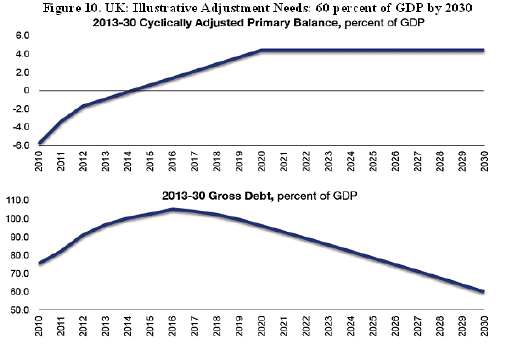
Of course this reflects specific assumptions on r-g and a specific target, so Figure 11 shows for the main advanced economies in need of fiscal adjustment, results of possible combinations of plausible r-g and debt targets (either 60 or 80 percent).
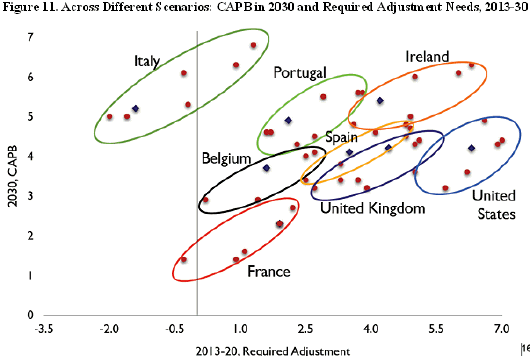
We see several things from this figure:
- First the margin of uncertainty is pretty wide for most countries
- Second, in relative terms France and Belgium are in a better relative position
- Third, countries like Spain, U.K. and U.S. would have to run primary surpluses of the order of 4 percentage points of GDP, although in some scenarios the primary surplus target could have to be more moderate.
- And they would have to improve, with respect to the current level, by an even larger amount as they are still running primary deficits.
- One interesting case is Italy where limited or no further adjustment would be needed but whose challenge would be to keep primary surpluses at a very high level for a long time.
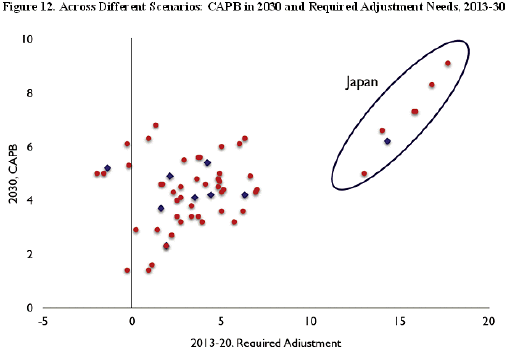
- Japan is missing in Figure 11; it is shown separately in Figure 12. Clearly medium term adjustment needs are much larger (or alternatively, Japan will continue to live with very high debt for a very long time).
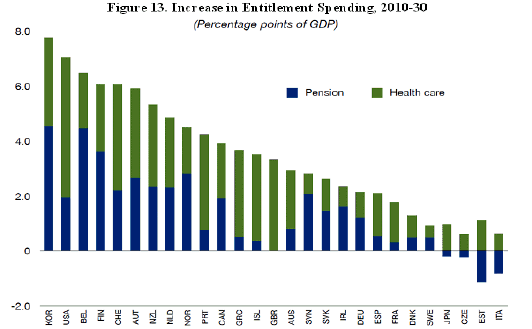
But even for other countries, lowering public debt will require large adjustments and keeping primary balances at high levels for a long time. Moreover, many countries will be, so to speak, swimming against the tide, as it will also be necessary to introduce policies to contain the rise in spending for pension and health care that is projected to occur by 2030, which is particularly strong for countries like the United States, second in this ranking, while they are low for Japan and Italy (Figure 13).
The difficulty of the task prompts one question: are there shortcuts? The most obvious ones are inflation and some form of debt restructuring.
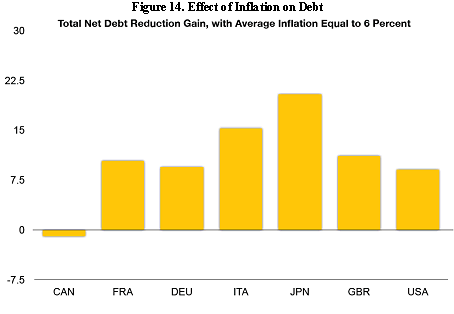
How much can inflation help? Inflation helps in two ways. First, it increases seignorage, that is the amount of resources that governments can buy by printing money. Second, it erodes the real value of public debt in circulation issued at fixed interest rates. The latter effect depends on how much nominal rates respond to inflation and on the maturity of public debt. We did some calculations. Assuming that interest rates on new debt respond fully to higher inflation, raising inflation to moderate levels, say 6 percent, instead of 2 percent, would erode public debt after 5 years by 10 percentage points of GDP for most countries, except Italy and Japan were the effect would be larger (Figure 14). These are not trivial effects (you need to add to this about 2-3 percentage points coming from increased seignorage), but far from solving the whole problem. In addition a country like Italy would not be in a position to decide its own inflation rate, as it is part of a currency area in which, by the way, other countries would benefit much less from inflation. If you add to this the difficulty of keeping inflation at moderate level—you could set yourself on a slippery slope—and the costs of bringing inflation down, raising inflation does not seem to be the right solution. Of course somewhat higher inflation is, already now, eroding the value of debt ratio and is helping some countries in the context of relaxed monetary conditions: interest rates have been largely negative for many advanced economies. But I have doubts about the possibility of pushing this further and to use inflation as the main element of a fiscal adjustment strategy.
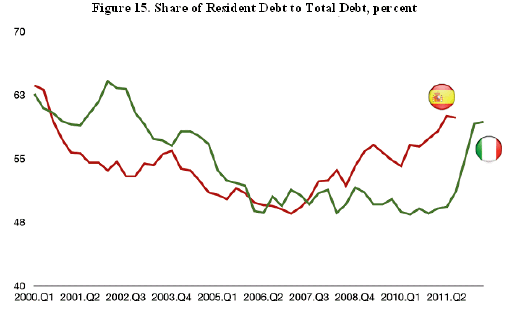
How about debt restructuring? Debt restructuring—not paying creditors at least in part to speak in plain language—is not a cost-free option. The literature on opportunistic default has focused on the costs arising from loss of credibility and the difficulty of returning to markets. But, in addition to these costs, we should not forget that default is a tax on the bond-holder and, if bond-holders are residents, it operates as a wealth tax of massive proportions. It is therefore strange that debt restructuring is sometimes seen as an alternative to fiscal tightening, as if it had no demand effects. Of course, if your creditors are abroad the tax falls on foreigners. At present, in countries like Spain and Italy, this tax would fall in large part on the domestic sector (Figure 15), including banks, which, presumably would have to be supported, thus reducing the benefits from any debt restructuring. But, even if the bonds are held abroad, but by your neighbors, the spill over effects can be massive, as the recent experience of the Greek debt restructuring in the euro area has shown. In sum, the costs of debt restructuring appear to be quite high.
Altogether, even if the challenges are major ones, it would still seem preferable to bring debt down to safer levels through orthodox tools. For this to work well, it is, however, critical to ensure that the r-g differential remains well behaved, so that among all the scenarios that we have seen above we end up with the most favorable ones. This requires two things.
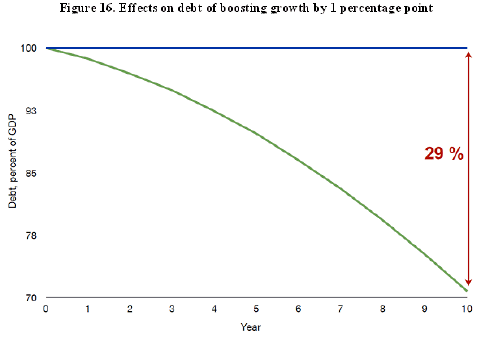
First, it is necessary to act as much as possible to raise potential growth rates though structural reforms to boost productivity and labor market participation. The effects of growth on the debt to GDP ratio go not only through the denominator of this ratio but also through the numerator and so they go beyond the effect on r-g. It stands to reasons that it is easier to run primary surpluses when the economy has a large potential growth rate. Indeed, if the revenues arising from higher growth are saved, the impact on the debt ratio is huge. As an illustration, consider a country that has a debt ratio of 100 percent and a tax ratio of 40 percent of GDP. If such a country manages to raise its potential growth by 1 percentage point and saves all the additional revenues, after ten years the debt ratio would be lowered by almost 30 points of GDP (Figure 16). So growth can have huge effects on the debt ratio.
The second thing that is critical is to keep interest rates under control. This is essentially a matter of confidence, which becomes of the utmost importance when public debt is high. The recent experience of European countries shows how easy it is to fall into a bad equilibrium in which high interest rates make unsustainable a debt that at more normal interest rates is unsustainable. The IMF has argued that a strategy to keep interest rates low should be based on the following components:
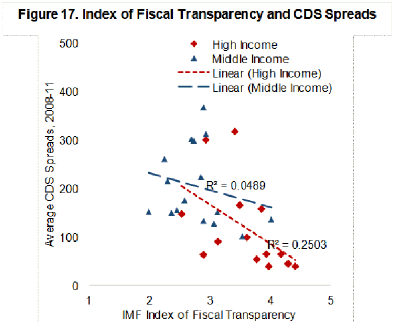
First, the existence of a clear medium-term fiscal plan and strong fiscal institutions: a medium-term fiscal adjustment plan that is sufficiently specific provides some certainty about future policy actions and—if defined in cyclically adjusted terms—allows the automatic stabilizers to operate to support economic activity. Most advanced economies have defined such a plan, to various degrees of specificity. The U.S. and Japan still have not have achieved political consensus on such plans, although the U.S. has managed to reduce its deficit significantly even in the absence of a plan. As to fiscal institutions, we have argued that fiscal rules, appropriate processes for the preparation, approval and execution of the budget, and institutions supporting fiscal transparency like fiscal councils are empirically associated with stronger fiscal performance and lower risk premia, as shown in Figure 17 with respect to the relationship between fiscal transparency indexes and CDS spreads.
Second, an appropriate and credible pace of fiscal adjustment. In our view the pace of fiscal adjustment should reflect three considerations: the magnitude of the initial fiscal imbalances (countries with larger imbalances should adjust more rapidly), the intensity of market pressures (countries that are under more market pressure should adjust more rapidly), and the state of the economy. In particular, for countries that are not subject to market pressure and have adopted a credible medium-term adjustment plan, we have argued that a gradual adjustment (not a front-loaded adjustment) is appropriate on two accounts:
- First, multipliers are likely to be high at this juncture in which output is demand driven and interest rates are already low; indeed, in principle it would be better to postpone the adjustment to a phase in which there is too much private sector demand, not too little. But a full postponement would not be credible: some adjustment must take place now.
- Second, there is the risk of what I called “too much of a good thing”: fiscal adjustment that leads to a large output deceleration can be counterproductive as markets become worried about the fall in GDP and interest rates rise instead of falling.
The third component of a credible fiscal strategy to keep interest rates low relates to the tools to implement fiscal adjustment. The debate on whether spending should be cut or taxes should be raised is highly political because it affects the size of government and its role in the economy. I have two considerations to offer in this respect:
- First, the tools to implement fiscal adjustment should make it credible and conducive to growth. This means that, at least in Europe the adjustment should be focused on spending cuts because, in the context of already high tax rates, the impact on potential growth of their further increases would be large, while there are sizable pockets of nonproductive spending that can be cut. Things are partly different in the U.S. and Japan, where we see room for raising revenues, particularly through higher energy taxation and the elimination of the so-called tax expenditures—special tax treatment of certain activities or taxpayers.
- Second, there is a need for reforming entitlement spending. We already looked at trends in pension and health care spending in the absence of further reforms. The main challenge is health care reform where the projected increases are larger. The advantage of these reforms is that they often do not have an immediate impact on aggregate demand but can have important effects in the long run and they signal commitment to introduce difficult policy measures. I have to recognize that there is little empirical evidence that entitlement reform has a direct impact on interest rates on government paper: interest rates model include deficit, debt but they do not usually include measures of, for example, the net present value of future liabilities arising from entitlement programs. But, even if these were the case, reforms in this area are critical as, in the absence of reforms, over time deficit and debt would be affected by rising entitlement spending.
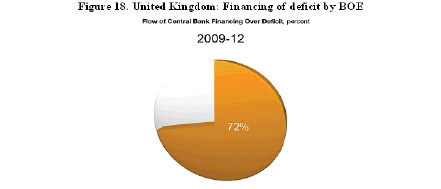
The fourth and final component is a relaxed monetary policy as long as fiscal adjustment proceeds. I have argued that fiscal tightening will have a contractionary effect. It is therefore important that monetary policy continues to support economic activity as much as possible. It is also important that, as long as the demand for liquidity remains high, the supply remains abundant and this implies direct or indirect purchases of government paper by central banks. This will benefit the government paper market in two ways. First, by lowering directly the supply of government paper that needs to be purchased by the private sector. And, second, by maintaining a high liquidity in the market and providing a role of lender of last resort in case of temporary confidence losses. I realize I am walking a minefield here. The risk of fiscal dominance and a loss of confidence in the value of money are not trivial and, as I said, very high inflation rates would be needed if this were the main tool of fiscal adjustment. That is why I emphasized that relaxed monetary conditions and support to the government paper market should continue as long as fiscal adjustment proceeds. Central bank financing cannot be seen as a substitute for fiscal adjustment. This said, the effectiveness of central bank financing in breaking self-fulfilling expectations has been made apparent by the introduction of the Outright Monetary Transactions by the ECB. More generally, there has been a surge of central bank financing to governments, one good example being the U.K. where the Bank of England, over the last four years, has financed three quarters of the U.K. Treasury deficit (Figure 18).
Let me conclude. In several advanced economies, at least 10 as we discussed, the fiscal accounts are still in a fragile state. In these countries, it will take decades to lower public debt to where it was before the crisis or, in any case, to levels that do not expose countries to risk. But the task is not impossible and good shortcuts are not available. What is critical is to ensure that the direction of the adjustment is clear and that the adjustment process is perceived as credible.
Thank you very much.
1 See for example: Reinhart, C., and K. Rogoff, 2009, “ This Time Is Different: Eight Centuries of Financial Folly,” (Princeton: Princeton University Press); Cecchetti, S.G., M.S. Mohanty and F. Zampolli, 2011, “The Real Effects of Debt,” BIS Working Paper No. 352; and Kumar, M., and J. Woo, 2010, “Public Debt and Growth,” IMF Working Paper No. 10/174 (Washington: International Monetary Fund).
|
We called for a fiscal expansion in spite of the fact that the state of public finances in 2007 was not particularly good by historical standards. Already in 2007 the public debt to GDP ratio in advanced economies was at a historical peak (Figure 1) as a result of a trend increase that, since the mid-1970s, had involved all the major advanced economies, except U.K. and Canada (Figure 2). And yet we felt the risks of a great depression were too large and justified a bold fiscal action.
In these conditions, deficits rose rapidly both in headline and cyclically adjusted terms (Figure 3). Note that the deterioration of the cyclically adjusted deficit between 2007 and 2009, at about 4 percentage points of GDP, was larger than the discretionary fiscal stimulus (about 2 percentage points), because, in our calculations, we assume that potential output declined as a result of the crisis and that, consequently, there was a loss of revenues that, while structural, was not due to discretionary actions. This is important to keep in mind as some, like Krugman, argue that the loss of potential output was not large, and therefore, the deterioration of the structural deficit was not as large, as revenues will come back.
As deficits increased and GDP declined, the average public debt ratio surged, and is projected at over 110 percent of GDP at end-2013, not too far away from the World War 2 historical record. However, four factors make the current situations even more difficult than after World War 2 (Figure 4):
Things, unfortunately, are much weaker at present across these four dimensions. So far, I have presented data about averages, but it is important to look beyond averages as the situation is really different across advanced economies. We can classify advanced economies in three groups (Figure 5).
The first includes countries that already managed to stop the rise in public debt. In Figure 6 you will see on the vertical axis the level of the deficit and on the horizontal axis the change in the debt ratio with respect to 2007. The average balance for this country group was in surplus in 2007. This balance moves into a small deficit in 2009; debt increases, but then already in 2011 things are brought under control. As to individual countries, Sweden and Switzerland are the best performers.
The second group includes countries with fiscal accounts that are also in a fairly good shape. Debt ratios have increased in 2012 but at relatively low levels, and the projected increase for 2013 is fairly small (Figure 7).
The third group includes ten countries where fiscal pressures are most severe (Figure 8).
These countries started the crisis with weaker fiscal positions, suffered a larger deterioration in their deficit, which started declining only in 2011, but not enough to stop the increase in public debt. All countries in this group have debt ratios higher than 90 percent of GDP. So, when we talk about fiscal problems in advanced economies we are talking primarily about these ten countries. The good news is that the number is not very large. The bad news is that these countries represent 70 percent of advanced economies GDP and 43 percent of world GDP. In evaluating the difficulty of implementing fiscal adjustment in the coming years, we will have to focus on these 10 countries. How difficult will it be for these countries to bring the fiscal accounts under control over the medium term? It depends on two things. First, is what we mean by “bringing public finances under control,” second, on the assumption we make about interest rates and growth. Regarding the first question, what we mean by “bringing public finances under control,” stabilizing the debt to GDP ratio at the currently high levels would in principle be consistent with maintaining fiscal solvency: as long as the debt ratio is stable (and assuming a positive interest rate –growth differential) the government’s inter temporal budget constraint—or equivalently the No-Ponzi game condition—would be met. However, there are two good reasons not to aim at such a modest target: First, stabilizing public debt at the current level would leave countries exposed to confidence shocks, given possible doubts about the ability to raise the primary surplus further from an already high level. Second, there is evidence that high public debt, at least behind a threshold of 80-90 percent, lowers potential growth by about 0.2 percent every 10 percentage point of GDP.1 So, the goal of the strategy should be to lower the debt ratio over time to at least below 80 percent. How long will it take? How high should the primary balance be? A lot depends on the assumption on interest rates and growth. The interest rate on public debt affects the speed at which debt accumulates. The growth rate of GDP affects the denominator of the public debt to GDP ratio. Both therefore affect the dynamics of the debt to GDP ratio. Historically, in advanced economies, the debt to GDP ratio has averaged 1¼ percent in the twenty years preceding the crisis (Figure 9). It has trended downwards during this period, perhaps reflecting increasing savings coming from emerging economies, which has contributed to lowering interest rates in the pre-crisis years. With the crisis, the average differential has edged up but remains below the historical average.
What will happen in the future? In principle, there is clear econometric evidence that interest rates are positively affected by the level of public debt (with 10 percentage points more of debt raising interest rates by some 30-40 basis points), while, as I said, the growth rate is negatively affected. So we should expect the differential to be higher than before the crisis. But the uncertainty around these point estimates is large. Moreover, various factors affect interest rates, such as the composition of the investors, base and the credibility of the fiscal strategy. It makes sense therefore to run some sensitivity tests around any baseline assumption. In what follows I will show you some illustrative adjustment scenarios in which the goal is to lower the debt to GDP ratio to a certain threshold by 2030, starting with what we project now will be the deficit in 2013. Figure 10, for example, shows the case of the U.K. We assume in these scenarios that the cyclically adjusted primary balance, that is the balance net of interest payments, adjusted for the effects of the economic cycle, reaches its required level by 2020, and then stays there for another 10 years so as to reach the debt target of 60 percent by 2030. Two things are relevant in assessing the difficulty of implementing these adjustments: the further improvement in the primary balance needed by 2030 and the level of the primary balance following 2020. In this case, the U.K. would have to improve its primary balance by another 4½-5 percent and maintain a surplus of about 4 percent for the following years.
Of course this reflects specific assumptions on r-g and a specific target, so Figure 11 shows for the main advanced economies in need of fiscal adjustment, results of possible combinations of plausible r-g and debt targets (either 60 or 80 percent).
We see several things from this figure:
But even for other countries, lowering public debt will require large adjustments and keeping primary balances at high levels for a long time. Moreover, many countries will be, so to speak, swimming against the tide, as it will also be necessary to introduce policies to contain the rise in spending for pension and health care that is projected to occur by 2030, which is particularly strong for countries like the United States, second in this ranking, while they are low for Japan and Italy (Figure 13). The difficulty of the task prompts one question: are there shortcuts? The most obvious ones are inflation and some form of debt restructuring.
How much can inflation help? Inflation helps in two ways. First, it increases seignorage, that is the amount of resources that governments can buy by printing money. Second, it erodes the real value of public debt in circulation issued at fixed interest rates. The latter effect depends on how much nominal rates respond to inflation and on the maturity of public debt. We did some calculations. Assuming that interest rates on new debt respond fully to higher inflation, raising inflation to moderate levels, say 6 percent, instead of 2 percent, would erode public debt after 5 years by 10 percentage points of GDP for most countries, except Italy and Japan were the effect would be larger (Figure 14). These are not trivial effects (you need to add to this about 2-3 percentage points coming from increased seignorage), but far from solving the whole problem. In addition a country like Italy would not be in a position to decide its own inflation rate, as it is part of a currency area in which, by the way, other countries would benefit much less from inflation. If you add to this the difficulty of keeping inflation at moderate level—you could set yourself on a slippery slope—and the costs of bringing inflation down, raising inflation does not seem to be the right solution. Of course somewhat higher inflation is, already now, eroding the value of debt ratio and is helping some countries in the context of relaxed monetary conditions: interest rates have been largely negative for many advanced economies. But I have doubts about the possibility of pushing this further and to use inflation as the main element of a fiscal adjustment strategy.
How about debt restructuring? Debt restructuring—not paying creditors at least in part to speak in plain language—is not a cost-free option. The literature on opportunistic default has focused on the costs arising from loss of credibility and the difficulty of returning to markets. But, in addition to these costs, we should not forget that default is a tax on the bond-holder and, if bond-holders are residents, it operates as a wealth tax of massive proportions. It is therefore strange that debt restructuring is sometimes seen as an alternative to fiscal tightening, as if it had no demand effects. Of course, if your creditors are abroad the tax falls on foreigners. At present, in countries like Spain and Italy, this tax would fall in large part on the domestic sector (Figure 15), including banks, which, presumably would have to be supported, thus reducing the benefits from any debt restructuring. But, even if the bonds are held abroad, but by your neighbors, the spill over effects can be massive, as the recent experience of the Greek debt restructuring in the euro area has shown. In sum, the costs of debt restructuring appear to be quite high.
Altogether, even if the challenges are major ones, it would still seem preferable to bring debt down to safer levels through orthodox tools. For this to work well, it is, however, critical to ensure that the r-g differential remains well behaved, so that among all the scenarios that we have seen above we end up with the most favorable ones. This requires two things. First, it is necessary to act as much as possible to raise potential growth rates though structural reforms to boost productivity and labor market participation. The effects of growth on the debt to GDP ratio go not only through the denominator of this ratio but also through the numerator and so they go beyond the effect on r-g. It stands to reasons that it is easier to run primary surpluses when the economy has a large potential growth rate. Indeed, if the revenues arising from higher growth are saved, the impact on the debt ratio is huge. As an illustration, consider a country that has a debt ratio of 100 percent and a tax ratio of 40 percent of GDP. If such a country manages to raise its potential growth by 1 percentage point and saves all the additional revenues, after ten years the debt ratio would be lowered by almost 30 points of GDP (Figure 16). So growth can have huge effects on the debt ratio.
The second thing that is critical is to keep interest rates under control. This is essentially a matter of confidence, which becomes of the utmost importance when public debt is high. The recent experience of European countries shows how easy it is to fall into a bad equilibrium in which high interest rates make unsustainable a debt that at more normal interest rates is unsustainable. The IMF has argued that a strategy to keep interest rates low should be based on the following components: First, the existence of a clear medium-term fiscal plan and strong fiscal institutions: a medium-term fiscal adjustment plan that is sufficiently specific provides some certainty about future policy actions and—if defined in cyclically adjusted terms—allows the automatic stabilizers to operate to support economic activity. Most advanced economies have defined such a plan, to various degrees of specificity. The U.S. and Japan still have not have achieved political consensus on such plans, although the U.S. has managed to reduce its deficit significantly even in the absence of a plan. As to fiscal institutions, we have argued that fiscal rules, appropriate processes for the preparation, approval and execution of the budget, and institutions supporting fiscal transparency like fiscal councils are empirically associated with stronger fiscal performance and lower risk premia, as shown in Figure 17 with respect to the relationship between fiscal transparency indexes and CDS spreads.
Second, an appropriate and credible pace of fiscal adjustment. In our view the pace of fiscal adjustment should reflect three considerations: the magnitude of the initial fiscal imbalances (countries with larger imbalances should adjust more rapidly), the intensity of market pressures (countries that are under more market pressure should adjust more rapidly), and the state of the economy. In particular, for countries that are not subject to market pressure and have adopted a credible medium-term adjustment plan, we have argued that a gradual adjustment (not a front-loaded adjustment) is appropriate on two accounts:
The third component of a credible fiscal strategy to keep interest rates low relates to the tools to implement fiscal adjustment. The debate on whether spending should be cut or taxes should be raised is highly political because it affects the size of government and its role in the economy. I have two considerations to offer in this respect:
The fourth and final component is a relaxed monetary policy as long as fiscal adjustment proceeds. I have argued that fiscal tightening will have a contractionary effect. It is therefore important that monetary policy continues to support economic activity as much as possible. It is also important that, as long as the demand for liquidity remains high, the supply remains abundant and this implies direct or indirect purchases of government paper by central banks. This will benefit the government paper market in two ways. First, by lowering directly the supply of government paper that needs to be purchased by the private sector. And, second, by maintaining a high liquidity in the market and providing a role of lender of last resort in case of temporary confidence losses. I realize I am walking a minefield here. The risk of fiscal dominance and a loss of confidence in the value of money are not trivial and, as I said, very high inflation rates would be needed if this were the main tool of fiscal adjustment. That is why I emphasized that relaxed monetary conditions and support to the government paper market should continue as long as fiscal adjustment proceeds. Central bank financing cannot be seen as a substitute for fiscal adjustment. This said, the effectiveness of central bank financing in breaking self-fulfilling expectations has been made apparent by the introduction of the Outright Monetary Transactions by the ECB. More generally, there has been a surge of central bank financing to governments, one good example being the U.K. where the Bank of England, over the last four years, has financed three quarters of the U.K. Treasury deficit (Figure 18).
Let me conclude. In several advanced economies, at least 10 as we discussed, the fiscal accounts are still in a fragile state. In these countries, it will take decades to lower public debt to where it was before the crisis or, in any case, to levels that do not expose countries to risk. But the task is not impossible and good shortcuts are not available. What is critical is to ensure that the direction of the adjustment is clear and that the adjustment process is perceived as credible. Thank you very much. 1 See for example: Reinhart, C., and K. Rogoff, 2009, “ This Time Is Different: Eight Centuries of Financial Folly,” (Princeton: Princeton University Press); Cecchetti, S.G., M.S. Mohanty and F. Zampolli, 2011, “The Real Effects of Debt,” BIS Working Paper No. 352; and Kumar, M., and J. Woo, 2010, “Public Debt and Growth,” IMF Working Paper No. 10/174 (Washington: International Monetary Fund). |
IMF EXTERNAL RELATIONS DEPARTMENT
| Public Affairs | Media Relations | |||
|---|---|---|---|---|
| E-mail: | publicaffairs@imf.org | E-mail: | media@imf.org | |
| Fax: | 202-623-6220 | Phone: | 202-623-7100 | |


