Statement by Mr. Luis Valdivieso, Advisor, Asia & Pacific Department of the IMF at the donors conference for East Timor, Canberra, June 14-15, 2001
June 15, 2001
Advisor, Asia and Pacific Department of the IMF
Canberra, June 14-15, 2001
1. It is a great pleasure for me to represent the International Monetary Fund in this meeting today and have the opportunity to present an overview of our recent macroeconomic assessment, with emphasis on the sustainability of the fiscal program for which you are being asked to provide additional grant financing. In my remarks I will discuss the short term macroeconomic outlook, and then advance a preliminary assessment of fiscal sustainability and external viability in a context of an illustrative medium-term policy framework consistent with poverty reduction.
2. Let me say at the outset that we fully share the views expressed by previous speakers that despite the significant progress made to date, there are important challenges ahead. The economic strategy pursued so far has placed emphasis on emergency relief and reconstruction and has been successful in taking the initial steps needed to ensure price stability and creating an economic environment conducive to economic recovery.1 The two key institutions to manage the economy—the Central Fiscal Authority (CFA) and the Central Payments Office (CPO) have made substantial progress and are closer to become fully operational; the National Planning Agency is also being developed and there is a blueprint for the creation of the Central Statistical Office. There has also been progress in developing and adopting important components of a basic economic regulatory and legislative framework, particularly in the areas of budgeting and fiscal financial management, taxation and tax administration, payments, banking and foreign exchange operations.
3. There are several issues that remain to be addressed, however. From the policy stand point, there is a need to address effectively valid concerns that the public expenditure path being ingrained in the economic system might become unsustainable over the medium term. The use of the U.S. dollar must be deepened. The credit market needs to expand, the labor market segmentation must be dealt with to break the coexistence of sizable unemployment with increasing pressures on wages in urban areas, and the land market needs to be developed. The economic institutions must evolve further. In particular, the CFA has began strengthening the areas of procurement and auditing, whereas the CPO is about to be transformed into a Banking and Payments Authority, with enhanced functions and accountability, and organizational and financial autonomy. The regulatory and legislative framework for creating an enabling environment for private sector development needs to be put in place rapidly, if the investment required to achieve high and sustained growth over the medium term is to be attracted. In particular, there is a need to reach a final decision on the drafts and adopt the corporate law, the foreign investment law, and the labor code. Equally important will be to develop soon a collateral law and the land and property law.
4. Without diminishing the importance of addressing immediate issues and problems, the approach of independence offers an opportunity to shift the emphasis of the economic strategy from crisis management to the promotion of high and sustainable growth as a means to reducing the existing critical level of poverty.
Short Term Outlook
5. The macroeconomic outlook for 2001 and 2002 remains favorable, as projected at the end of 2000. Real GDP growth is likely to remain strong, fueled by the increase in public expenditures early this year and the additional expansion envisaged for next fiscal year. The withdrawal of the U.N. is bound to have an adverse impact on growth, but it could be partially offset if the country embarks early on achieving a path of higher growth aimed at reducing poverty. Inflation is also likely to remain low, although some step corrections in the level of certain prices may be experienced in connection with the expected strict enforcement of collections on public utilities user fees. Investment is expected to peak in 2001 reflecting a steady implementation of the reconstruction program, but the recovery of domestic savings will take some time (Table 1).
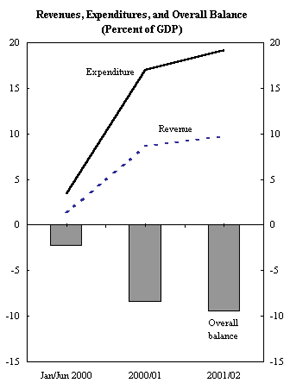
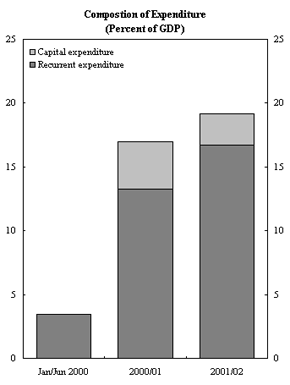
6. The draft budget for FY01/02 is expansionary. The proposed CFET deficit would increase from 8.4 percent of GDP in FY00/01 to 9.4 percent of GDP in FY01/02 driven by an increase in expenditure.2 CFET expenditure for FY01/02 amounts to $71 million (19 percent of GDP),3 almost a third higher than the projected outcome for FY00/01 (Tables 2 and 3 and Figure 1). Recurrent expenditures are planned to increase by over 40 percent, largely driven by an increase in wages and salaries. The increase in wages is explained almost in full by the newly targeted size of the civil service (to 14,639 up from 10,596 in FY00/01 and compared to 11,399 in the previous forward estimate for FY01/02).4 CFET capital expenditures are expected to fall moderately.
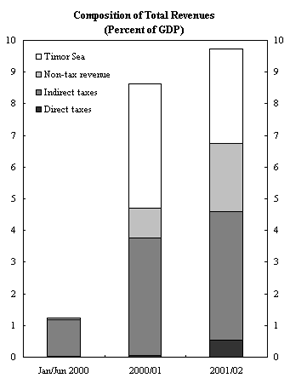
7. CFET revenues are projected at $36 million in FY01/02, almost a third higher than the projected outcome for FY00/01. Non-tax revenue is projected to increase almost three-fold based mainly on an improvement in the collection of user fees on power. Tax revenue is expected to increase by about 40 percent, with more than half of the growth explained by collection of taxes on ETTA agencies which until now had been de-facto exempted. Proceeds from Timor Sea oil and gas activities are expected to decline moderately. The total amount of revenues available to finance next year's budget would be $31 million, as ETTA recently decided to start using the tax component of oil and gas proceeds to support recurrent expenditure, and to keep the production sharing component ($5 million) in a special Timor Sea account until there is a strategy on the use of such resources.
8. The proposed budget implies a financing gap of about $20 million (5½ percent of GDP). In addition to revenues, there will be a carry forward from FY00/01 of $21 million.5 Since ETTA plans to keep about $1 million as cash reserve (equivalent to 5 days worth of CFET expenditure), this would leave $51 million available to finance the $71 million budget. Were the budget executed in full, by end-FY01/02, the government would still have assets in the Timor Sea special account amounting to $8 million, but it would have run down all its working balances with the United Nations Procurement System (UNOPS) and reduced its cash reserves to very low levels.
9. The proposed budget poses several concerns:
On the expenditure side, the main concern is the downward rigidity introduced by embarking on a high and self-propelling expenditure path. Particularly worrisome is the rapidly escalating size of the civil service. A second concern is the lack of information to form a comprehensive view of the future recurrent implications of total public expenditure. A third concern is the risk associated with the self-imposed reduction in the room for managing cash outlays in the event of revenue shortfalls or difficulties in reducing the amount of cash resources tied up by UNOPS for procurement. Finally, there is a potential for expenditure pressures arising from the inability of the off-budget agencies to raise the targeted amount of user fees collections, especially in the case of the power sector.
On the revenue side, the main concern is the heavy reliance on administrative measures to raise revenue. While the efforts to improve the administration merit support, particularly in the area of reducing exemptions and improving user fees collections, the question is whether the expectations are well founded. A decisive step to bring the UN contractors within the tax net and for the UN to settle its payables with the power sector would be a good signal to all taxpayers that there is the will and a leveled field.
On the deficit financing strategy, the main concern is whether or not the decision to finance higher levels of recurrent expenditure using non-renewable resources has taken into account long term implications for external financing requirements. The decision on the optimal inter-temporal allocation of non-renewable resources needs to be based on the medium and long-term objectives of economic policy and the options to finance the deficit. A sound deficit financing strategy needs to simultaneously reduce the reliance on external grants, maximize the return on the use of its non-renewable resources, and ensure that any borrowing is consistent with the country's capacity to repay. It follows from the above discussion that the definition of the medium and long-term economic policy objective and the economic strategy to be pursued to achieve it, has a significant bearing on the way to address these financing concerns and provides a good prism through which assess the sustainability and viability of today's policy measures.
Assessing Fiscal Sustainability and External Viability in a Poverty Reduction Context
10. Why should poverty reduction be the overriding objective of economic policy in East Timor? There seems to be a consensus view that poverty incidence is extremely high in East Timor, even though statistics on income, income distribution and poverty profiles are extremely limited.6 Reducing poverty within a reasonable time horizon will be without doubt the aspiration and the biggest challenge for a number of future governments of an independent East Timor. There is significant evidence that to reduce poverty, real income will have to grow at high and sustained rates. The challenge will be to move to a path of higher growth in real income that is sufficiently fast and sustained to reduce poverty while ensuring fiscal sustainability and external viability.
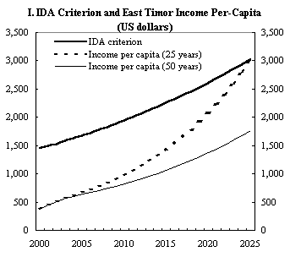
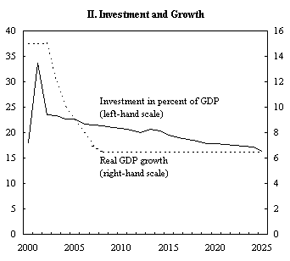
11. Determining the speed at which income needs to grow to address poverty requires clearly defined operational targets. For example, if the objective were to raise East Timor's per capita income from around $400 to the International Development Agency (IDA) low income country income threshold ($1,445 per capita) in the next 25 years, real GDP would need to grow by at least 6-8 percent per year for the next generation, assuming that the population grows between 1¾ to 2½ percent per year (Figure 2, Panels I and II).7
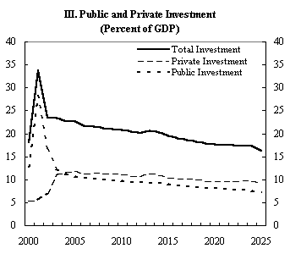
12. To sustain real GDP growth at 6-8 percent per year for a generation, total annual investment will need to be efficient and maintained at high levels. In the case of East Timor, it would seem unavoidable that the public sector will carry the initial burden of investment (including reconstruction of basic infrastructure), while a favorable climate for private investment is created (Figure 2, Panels II and III). For private investment to flourish it is essential that investors (i) develop a strong sense of internal security and political stability; (ii) can operate within a regulatory and legislative framework that is comprehensive, easy to administer, predictable and equitable and which is enforced and protected by a credible institutional set-up; (iii) can draw on capable indigenous administrative and managerial capacity as well as an adequately qualified pool of labor; and (iv) perceive a climate of sustained economic stability. In my presentation in Brussels last December, I outlined the progress achieved and the challenges that need to be addressed in each of these areas. Allow me to focus today on the policy requirements to maintain economic stability.8
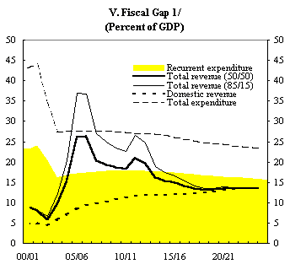
13. A sound fiscal policy stance will be critical to help maintain macroeconomic stability, whether or not East Timor continues to use the U.S. dollar as the legal tender. Supporting and sustaining high growth and reducing poverty will require a total public expenditure level consistent with the public investment program and that accommodates the administrative structure that is being put in place today, and the cost of maintaining the public sector capital stock. Even if total expenditure could be contained at an average of around 25 percent of GDP (i.e., slightly more than half of today's total expenditures), domestic revenues would be unlikely to rise sufficiently rapid to cover such demands on current policies. As a result there would be pressures to use all expected oil and gas revenues. The illustrative quantitative scenario prepared by the Fund staff would indicate that following an initial period of large but declining gaps, the expected oil and an gas resources9 would provide fiscal relief, but as they start declining some fiscal gaps would tend to reappear, building up pressures for grant financing or borrowing. The basic trend in the illustrative fiscal outlook would not change if the revenue split between East Timor and Australia is changed in favor of East Timor as a result of the ongoing negotiations (Figure 2, Panel V), but it could change if other fields in the Timor Sea were to be developed (e.g., the Sunrise Troubadour) and benefit East Timor. More fundamentally, since there is a considerable level of risk attached to oil and gas resources, ensuring fiscal stability will therefore require taking very decisive steps to mobilize domestic resources, maintain a tight rein on the level and composition of expenditure, and adopt a prudent financing strategy.
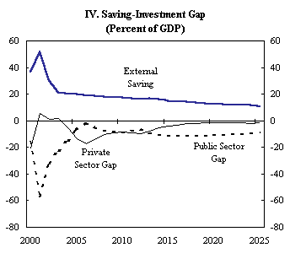
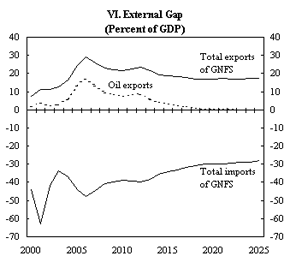
14. Private sector investment based on an outward-looking development strategy will be key to enhance East Timor's growth. Over the medium term, the private sector will also face a savings-investment gap that will need to be financed together with the possible fiscal gaps (Figure 2, Panels IV and VI). This implies that macroeconomic policies and the regulatory framework must be oriented towards promoting export growth to ensure that the country has the capacity to service external public and private liabilities. Maintaining external competitiveness of non-oil and gas exports will rely on the adoption of a sound fiscal policy, enhanced labor market flexibility, and the maintenance of a liberal trade system, independently of East Timor's decision to continue to use the U.S. dollar as legal tender.
15. In closing, a newly independent East Timor government will not only have to continue the process of reconstructing and rehabilitating the economy but will also face serious challenges in making today's policy decisions consistent with a policy framework needed to address the prevailing critical poverty levels. We note with satisfaction that ETTA authorities are aware of the risks associated with the budget being proposed for FY01/02 and that steps are being taken to address them. Against this background, we would support the request for additional grant financing, in the understanding that the limits of sustainability are being put to a test. ETTA authorities, and those of the future independent East Timor, must monitor revenue and expenditure developments very closely and should stand ready to address any deviation in the proposed expenditure plan or shortfall in revenue with fiscal measures, not with additional requests for financing. The level of expenditure being proposed is already high and likely to introduce serious rigidities in expenditure management over the medium term. To gauge such implications, a medium term policy framework geared towards poverty reduction needs to be developed as soon as possible. To that end a number of analytical studies and broad information gathering to be used in decision making will be required, and the efforts already being made in this direction should be intensified and supported. Even on the basis of our limited knowledge, the message emerging from an illustrative scenario is that there is no room for complacency, and the pursuit of fiscal prudence and decisive actions to develop the right environment for private sector activity are imperative. While the domestic effort and the private sector response have a critical role to play to ensure success, there will also be a need for continued external financial assistance. The discussion on the policy and financing options available to address the financing requirements associated with an effort to reduce poverty is a matter that will need to be addressed sooner rather than later, and it should be conducted jointly between the East Timorese and all stakeholders who share their aspirations of getting East Timor out of poverty. It will be a privilege for the IMF to participate in such an endeavor.
APPENDIX I
Recent Economic Developments
Indicators of activity and prices are limited, but those available signal favorable trends. The recovery initially centered on activities associated to the international presence and reconstruction effort, has expanded to agriculture, particularly coffee, maize and corn. Rupiah-denominated consumer prices are rising at an annualized rate of less than 1 percent.
Employment appears to be rising rapidly but unemployment remains acute. The agricultural sector continues to be the main source of employment, followed by the central administration, services and construction. Despite reportedly sizable unemployment, the segmentation of the labor market in the face of increasing international demand for skilled workers has imposed upward wage pressures. Voluntary agreements on wage restrain, specially among the NGOs, have not been binding.
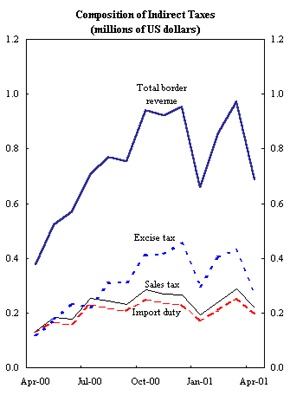
Budget execution for fiscal year 2000/01 is expected to be below target. The fiscal balance of the central administration (CFET) 10 is projected to close FY00/01 with an overall deficit of about $27 million, or 8 2/5 percent of GDP, compared with the original budget deficit of 13 percent (Tables 2 and 3, and Figure 1).
Overall revenue collections are projected to exceed expectations, but the performance of individual sources of revenue has been uneven. Domestic taxes and oil and gas fiscal revenues have been strong. Collections of user fees on power, water, and sanitary services have been dismal.
CFET expenditures have been rising rapidly since the third quarter of FY00/01, and will close about 7 percent below the original budget target. This has been facilitated by improvements in procurement, project execution, substantial expenditure reallocations, particularly to cover defense needs, and unanticipated one-off allocations.
It is estimated that the overall public expenditure in FY00/01 (i.e., funded by CFET, TFET, UNTAET and bilateral sources, excluding technical assistance) could reach $137 million, somewhat below previous estimates (Table 4). Continued difficulties in obtaining reliable information on bilaterally-funded expenditures, in particular, and on the economic classification, in general, make it difficult to examine expenditure trends in greater depth.
Financial intermediation continues to be weak. Despite favorable trends in deposits, commercial bank credit has been virtually negligible mainly due to the lack of adequate collateral (Table 5). Most credit extended in East Timor comes under the Small Enterprise Project (SEP) funded by the TFET. The interest rate under the SEP-lending facility is 10 percent. Commercial banks' loans to businesses range between 8.6 and 12.5, whereas consumer loans can be obtained at 14.6-16.5 percent.
The payments system is working well and the use of the U.S. dollar as means of payment is increasing gradually, but is still limited compared to the Indonesian rupiah. There is an ongoing effort to promote further the use of the U.S. dollar, including a special program to settle the purchase of the 2001 coffee crop fully in U.S. dollars. A licensing requirement for the importation of any foreign currency, based on the restrictions applicable in the country of origin of the currency to be imported, has been introduced recently.
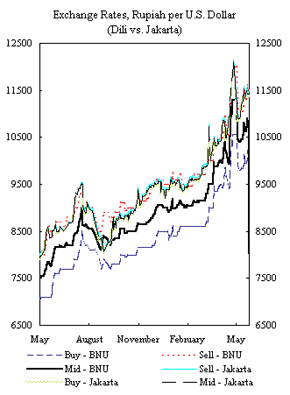
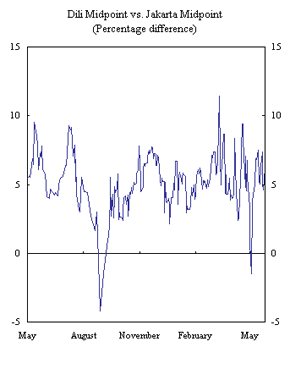
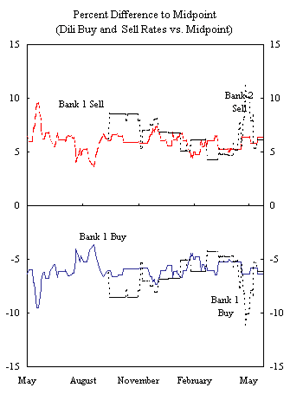
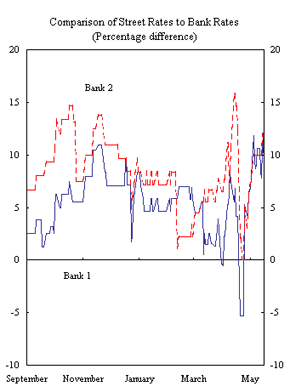
The foreign exchange market in Dili has continued to function relatively well. For several months, the margin between the mid-point of the rupiah-U.S. dollar exchange rate in Dili and in Jakarta has fluctuated within a narrow range and the spread between the buy/sell rate of the rupiah vis-à-vis the U.S. dollar has remained stable (Figure 3).
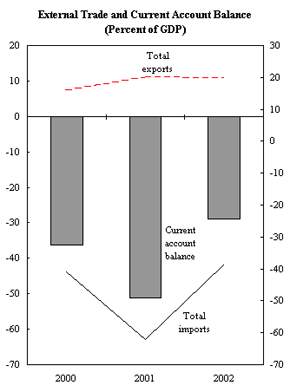
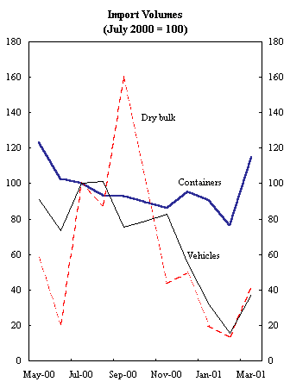
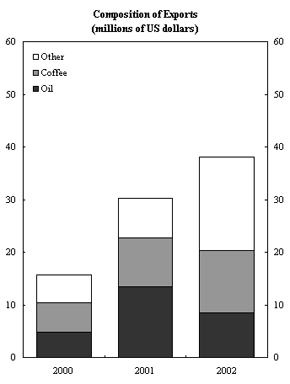
Trade activity continues to be dominated by the large foreign presence. Merchandise imports have continued to grow, mostly driven by aid-related imports. Coffee and oil and gas exports are also increasing but less rapidly. The merchandise trade deficit is estimated to rise from $84 million in 2000 to $131 million in 2001 whereas the current account deficit (excluding imports associated with UNTAET and humanitarian aid) is likely to increase from $105 million in 2000 to $176 million in 2001 (Table 6, and Figure 4).
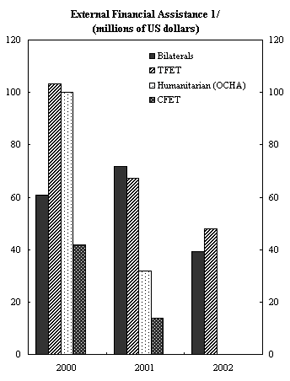
External financial assistance has continued to be generous. Donors pledged $153 million for 2001 (excluding UNTAET and OCHA), of which $81 million are to be channeled through CFET and TFET. The remaining $72 million are expected to be allocated to bilateral aid, including through UN agencies. By end-April 2001, TFET had obtained pledges amounting to $167 million of which $117 million had been received, including $35 million of promissory notes. Approximately $40 million have been disbursed. UNTAET has submitted a budget of about $600 million, based on maintaining its presence at the current level until June 2002. Assuming a gradual withdrawal of the UN from end-2001 onwards, the budget is likely to be around $566 million for 2001, of which about $270 million would be spent in the second half of 2001. About $1.5 million are budgeted to administer the elections for the constitutional assembly to be held in August 2001. Humanitarian aid is projected to decline to $32 million.
Work to strengthen the key economic institutions including training of officials has continued. The CFA and the CPO have continued to develop further. As envisaged in the original strategy recommended by the IMF, customs collection is to be integrated into the CFA and steps are being taken to establish a Banking and Payments Authority (BPA) to succeed the CPO. Modest progress has been made in building up indigenous managerial capacity in the key economic institutions. Specialized training on macroeconomic management to ETTA officials and general information seminars for members of the National Council have been provided.
APPENDIX II
East Timor: Selected Indicators of Poverty Incidence, Income Inequality, and Welfare
There seems to be a consensus view that poverty incidence is extremely high in East Timor. The statistics available on East Timor's income, income distribution, and poverty profiles are very limited and those available do not permit a precise determination of the number of people living in poverty. The little information available, however, is quite illustrative.
Based on traditional poverty indicators,11 the incidence of poverty in East Timor was double that the average for Indonesia. In early 1999, about 55 percent of the East Timorese fell below the poverty line, compared to a poverty rate of 27 percent for Indonesia.12 The poor were identified mostly as subsistence farmers producing nontraded goods in rural areas, where approximately 85 percent of the population live. Poverty was found to be highly correlated with family size and lack of education.
For the last five years, income per-capita has averaged less than $400. However, income inequality appears to be low. In 1998, the Gini coefficient was 0.31 in East Timor, compared to 0.37 for Indonesia.13 In early 2000, the wealthiest 20 percent of households had cash incomes that were only three times higher than the poorest 20 percent. 14
Most welfare indicators for East Timor are extremely low.15 In 1996, life expectancy was around 52 years, infant mortality rate (per 1,000) was 149, there were 15 medical doctors per 100,000 people, and the illiteracy rate was 50 percent (in some rural districts the illiteracy rate was above 60 percent). It is estimated that only 25 percent of the population had access to electricity and running water.
Ongoing efforts by the National Planning Agency in coordination with UN agencies and the IFIs to improve the understanding of poverty incidence and prepare a poverty profile and associated surveys should be supported.
| Figure 1 East Timor: Fiscal Indicators |
||
|---|---|---|
 |
 |
|
 |
 |
|
| Source: Data provided by the national authorities; and Staff estimates. | ||
| Figure 3 East Timor: Indonesian Rupiah/U.S. Dollar Exchange Rate Developments in Dili, 2000-01 |
||
|---|---|---|
 |
 |
|
 |
 |
|
| Sources: Central Payments Office, Dili; and Bloomberg. | ||
| Figure 4 East Timor: External Indicators |
||
|---|---|---|
 |
 |
|
 |
 |
|
|
Source: Data provided by the East Timor authorities; and Staff estimates. 1 Excludes UNTAET support of quasifiscal expenditures. |
||
1 Appendix I presents an overview of recent developments. 2 The CFET primary deficit (defined as current revenues minus non-interest recurrent expenditures) would increase from about 5.6 percent of GDP in FY00/01 to about 8.3 percent of GDP in FY01/02. 3 The draft budget approved by ETTA sets expenditures for $65 million, but this figure includes only net transfers to three agencies that have been moved off-budget: the power authority, the airport, and the port. The agencies are allowed to retain $6 million in projected user fees collections to cover additional expenditures. Consistent with previous years' presentation, the expenditure and revenues of these agencies are presented in gross terms. 4 If Cabinet decides to implement a civil service wage reform, the wage bill could increase by another $0.8 million (which is the amount set aside in the budget for such reform). 5 The calculation of the size of the carry over for FY01/02 assumes that all $14 million in donors pledges made in Lisbon and ratified in Brussels will be disbursed by year-end. However, as of end-May 2001, only $4 million had been disbursed. 6 Appendix II presents a few indicators that are very illustrative. 7 The low population growth estimate has been prepared by the Central Board of Statistics of East Timor Province (BPS) for the period 1993-98, whereas the higher-end is quoted Arneberg and Pedersen (1999) as corresponding to the average for the 1990s. 8 Maintaining stability requires sound macroeconomic policies and well-functioning and efficient markets for goods and factors of production as these provide the mechanism to transmit the effect of policies. The factor markets which require immediate attention are credit, labor and land. 9 As projected by the operators of the Elang Kakatua and Bayun-Undan fields and based on the existing production sharing arrangements. 10 The central administration includes both recurrent and capital expenditure funded by the Consolidated Fund for East Timor -(CFET)-but it excludes reconstruction expenditure funded by the Trust Fund managed by the World Bank-(TFET)-and directly by bilaterals. 11 Traditional poverty indicators are based on a poverty line approach which uses data on household consumption to estimate the proportion of people who are unable to meet the cost of basic needs. This approach does not capture important dimensions of poverty, such as access to education, civil liberties, freedom from discrimination, and people's ability to live long and healthy lives. 12 For 1999, estimates of the poverty line in East Timor vary from Rp 53,000 per month (Indonesian Bureau of Statistics (BPS)) to Rp 91,235 per month (M. Pradhan, A. Suryahadi, S. Sumarto, and L. Pritchett (2000), "Measurements of Poverty in Indonesia: 1996, 1999, and Beyond", SMERU Working Paper, June). For 2000, preliminary estimates of the poverty line vary from Rp 70,000 per month to Rp 100,000 per month (for a review of the different estimates, see Initial Poverty Assessment: East Timor, Asian Development Bank, in cooperation with East Timor Transitional Administration, September 2000). 13 Pedersen and Arneberg (editors), 1999. The Gini coefficient is a measure of inequality derived from the Lorenz curve. The closer the Gini coefficient is to zero, the more equal are incomes; the closer it is to one, the more unequal are incomes. 15 Pedersen and Arneberg (editors), 1999, and World Bank, Joint Assessment Mission (JAM) Report, available via internet: http://wbln0018.worldbank.org/eap/eap.nsf. | |||||||||||||||||||||||||||||||||||||||||||||


