Amid this year’s geopolitical rifts, one signal of uncertainty is flashing red; another, green; and a third, amber. Ordinarily, they tend to track one another.
This is no parlor game. High levels of uncertainty can freeze investment and consumption, tank markets, and help spark a recession.
What are we to make of this in assessing the direction of the global economy?
Let’s start with a review of how economists, investors, and policymakers gauge uncertainty.
How high is uncertainty?
Measuring uncertainty is not easy. The questions are uncertainty about whom, over what, and for what time period. There is no single dominant metric for uncertainty.
The three main measures rely on textual analysis, financial markets, and business surveys. Text-based measures now show exceptionally high levels of uncertainty. Everything you read, from newspapers to country reports to official publications, seems to discuss uncertainty. Financial-market-based measures, meanwhile, show only moderate levels of uncertainty. And survey-based measures, which spiked during the pandemic, have largely flatlined.
Perhaps the best-known text-based metric is the Economic Policy Uncertainty (EPU) Index developed by Baker, Bloom, and Davis (2016). The index analyzes articles in hundreds of newspapers for mentions of terms related to economics, policy, and uncertainty. This century, the EPU for the United States has typically surged during crises, spiking after events like the 2008 financial crisis and the 2020 COVID pandemic (Chart 1). In 2025, the EPU reached a record high, indicating extensive discussions of uncertainty in national and local newspapers.
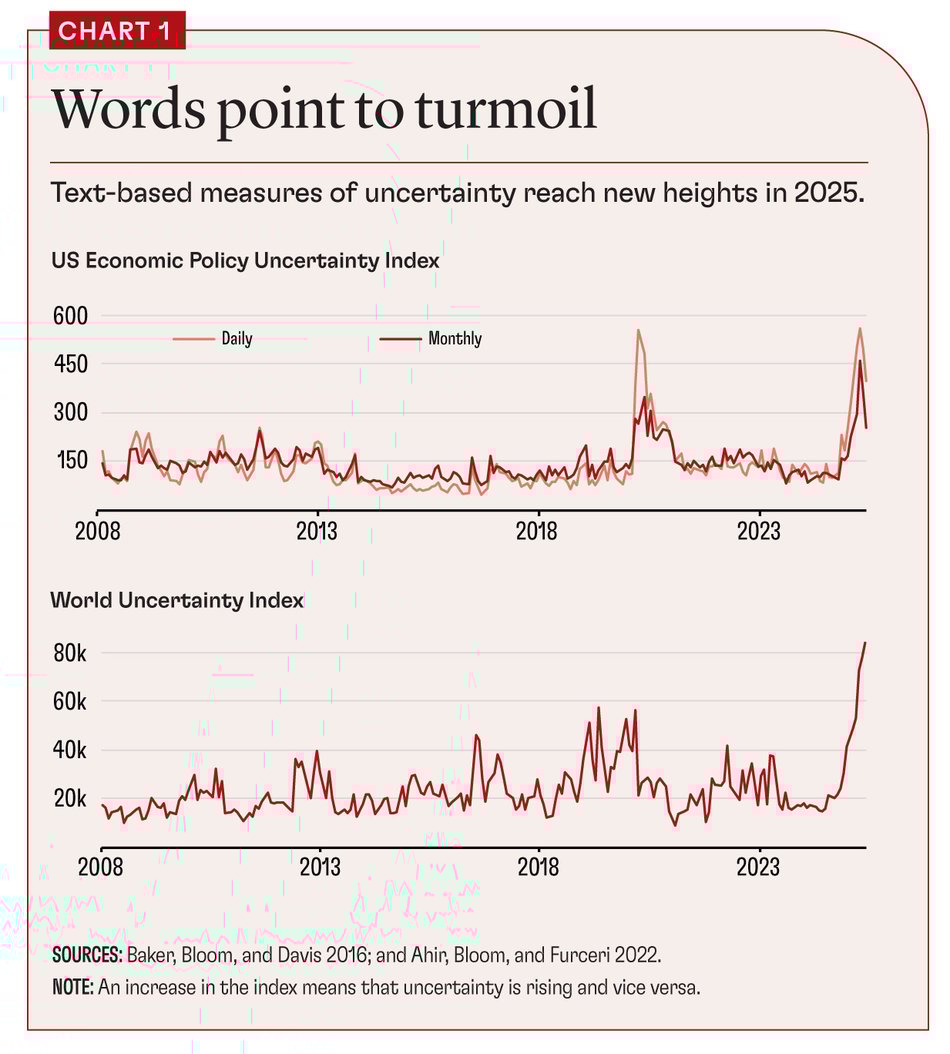
One concern with the EPU is that it may reflect media bias. We developed a second set of indicators based on the Economist Intelligence Unit’s country reports (Ahir, Bloom, and Furceri 2022). These reports appear monthly and provide a detailed discussion of political and economic conditions in 71 countries. By calculating the frequency of the appearance of the term “uncertain,” we created the World Uncertainty Index (WUI). It shows a similar trajectory as the EPU, suggesting that perceptions of elevated uncertainty—across countries—are not solely media-driven.
Concerns about using textual data to measure uncertainty include the evolution of language, potential bias in sources, and inaccuracies in word counts as measures of intensity. An alternative approach is to examine financial market volatility. The 32-year-old Chicago Board Options Exchange Volatility Index, known as the VIX, embodies this concept. It calculates the one-month-ahead implied volatility of the S&P 500 Index of US stocks, based on a basket of put and call options.
Significant spikes in the VIX over the past three decades occurred around economic and political shocks, such as the Asian and Russian financial crises in 1997 and 1998, the 2008 financial crisis, the 2011 debt ceiling crisis, and the 2020 pandemic (Chart 2). In 2025, the VIX has been elevated—reaching 32 in April—but that was not a large spike compared with previous jumps.
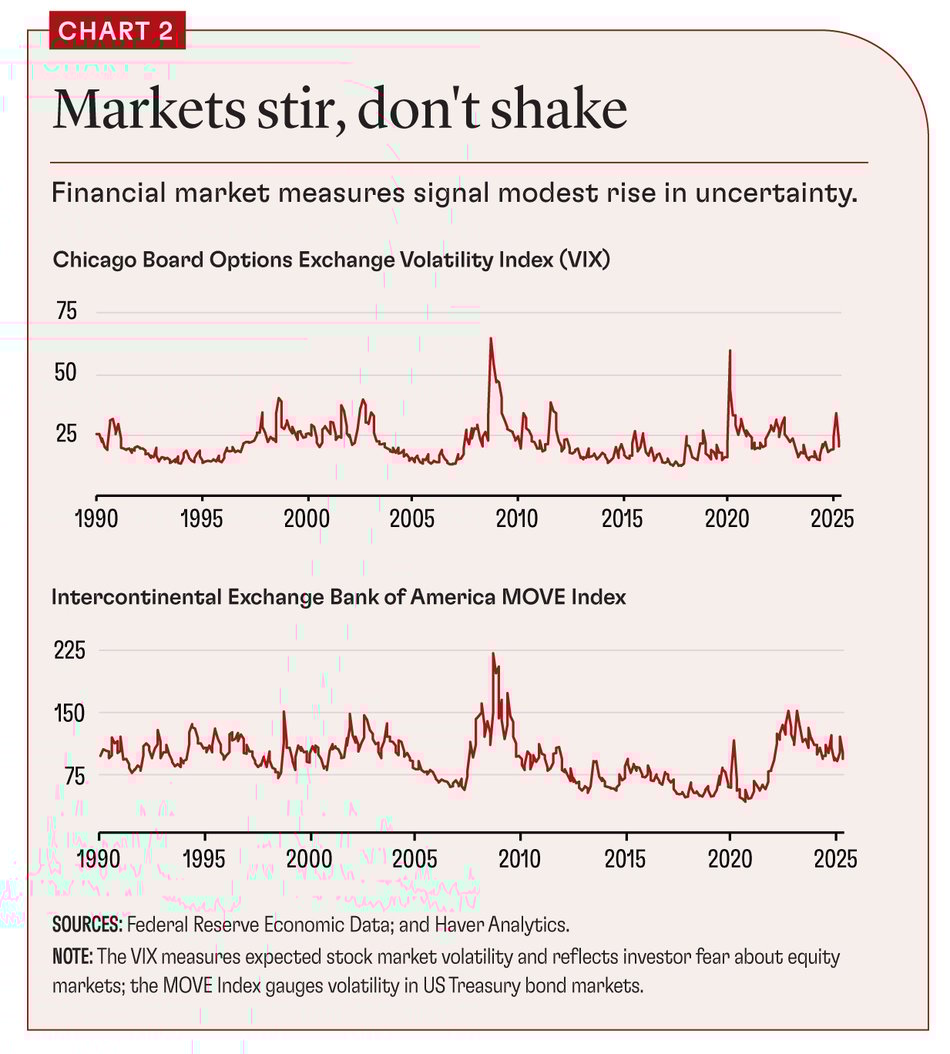
Other market-based measures—such as the Intercontinental Exchange Bank of America MOVE Index of implied volatility on bond yields—present a similar picture of increased but not extreme uncertainty.
In many ways, the most informative measure of uncertainty is how managers perceive future business conditions. Ultimately, it is uncertainty in the minds of executives that influences decisions about hiring and investment, which drive economic growth.
The US Survey of Business Uncertainty (SBU), administered by the Atlanta Federal Reserve Bank, queries almost 1,000 US businesses each month, collecting information about sales forecasts. As Altig and others (2020) show, these forecasts accurately predict business actions, including current and future hiring, investment, and sales.
This metric showed a significant surge in uncertainty during the pandemic, roughly doubling between January and May 2020, before slowly easing (Chart 3). Through June 2025, there was no uncertainty surge. One explanation is that businesses may not be following the economic or political news. However, the SBU panel did notably raise predictions for sales growth after the November 2024 election of Donald Trump. The forecasts declined in spring 2025 after the beginning of tariff wars.
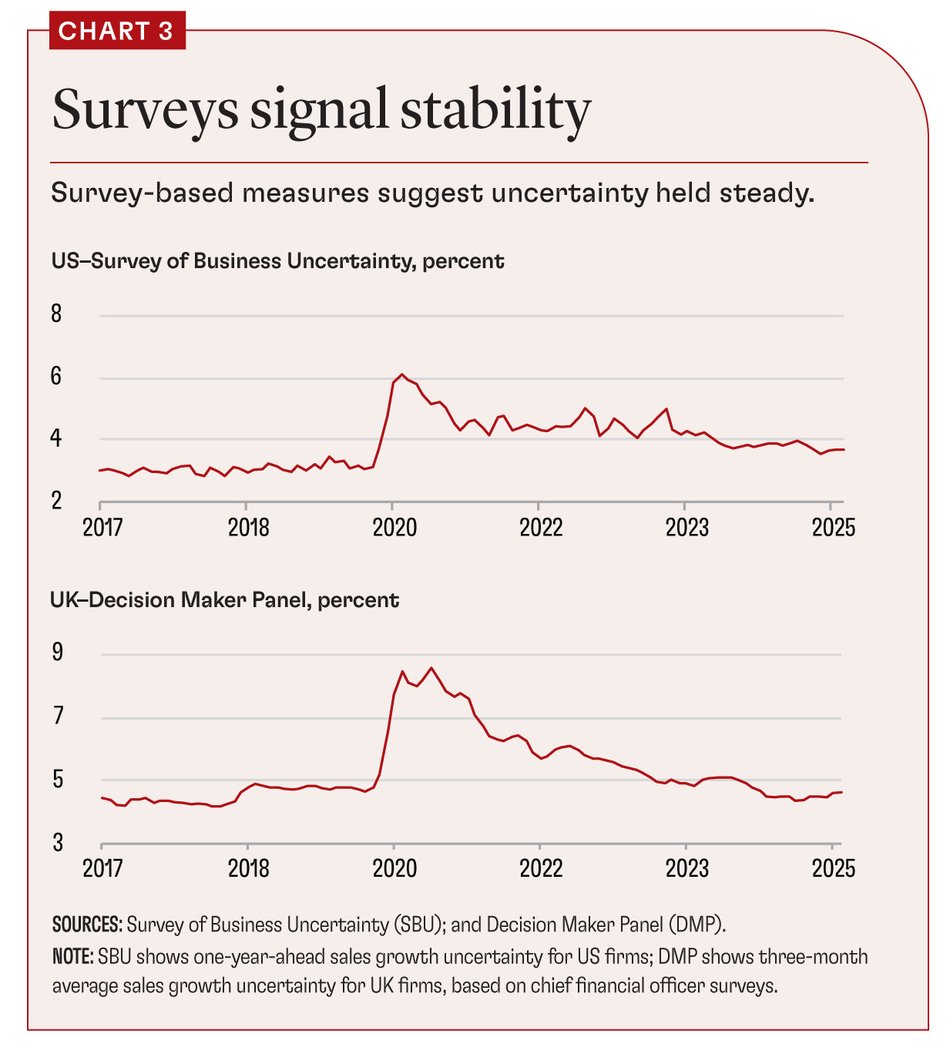
The UK’s Decision Maker Panel collects similar measures of company-level sales growth uncertainty. It polls about 2,500 businesses a month across the UK. As Chart 3 also shows, the UK sales uncertainty index followed a pattern similar to that of the US measure, with a surge during the pandemic but no recent increase.
It’s a little puzzling that the survey-based metrics don’t show a rise through June 2025, whereas the market-based measures increased moderately and the text-based indicators surged. These indices tracked each other remarkably closely over previous episodes, such as the pandemic and the financial crisis. One explanation is that text measures are excessively high because of the intense media focus on the Trump administration. Another is that because our financial and business measures are shorter term and US-focused, they may miss the rise in longer-term global uncertainty. Our sense is that the truth is somewhere in between—global uncertainty has risen, but not as much as text-based measures would suggest.