


Typical street scene in Santa Ana, El Salvador. (Photo: iStock)
IMF Survey: New IMF Data Mapper Has Improved Charting and Presentation
May 29, 2008
- Tool allows users to visualize economic data
- New version includes enhanced charting and presentation features
- Next upgrade will include additional datasets, multiple languages
A recently released new version of the IMF Data Mapper, an interactive tool for visualizing economic data, includes enhanced chart capabilities and expanded presentation features.
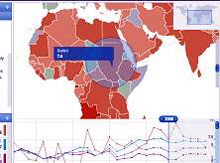
Users can use a variety of maps and charts to view economic data from various time periods by country, country groupings, or regions.
Data Interactivity
The new version of the IMF Data Mapper, launched in April to coincide with the release of the April 2008 World Economic Outlook (WEO), allows users to view economic data from various time periods by country, country groupings, or regions using a variety of charts and maps.
Version 2 enhancements
Enhanced chart capabilities to the IMF Data Mapper include:
• a logarithmic option for the Y-axis and the ability to show a variable over time using a "Play time" feature, which scrolls through the selected data in a playback mode;
• a scatter "bubble" chart with resizable circles that allows users to compare variables over time and displays a history trail of those variables; and
• a "Selected Messages" feature that can be used to illustrate messages via animated applications.
In addition, there are improved screen options: the map or chart view can be switched; the chart can be maximized; and a full-screen mode is now available.
Also added to the Data Mapper is the Joint IMF-OECD Statistics dataset. This combines selected data from both organizations to provide global indicators for key economic variables, including inflation and trade, on multiple frequencies (monthly, quarterly, and annual). Cathy Wright of the IMF's Statistics Department says, "Data Mapper offers a powerful interactive interface for this overarching set of critical data."
More improvements to come
Future versions of the application will allow internal users to better leverage its features and support additional datasets and multiple languages. In addition, users will be able to create their own animations and export them into PowerPoint presentations. The IMF Data Mapper will also be made available from the Economic Data Warehouse (to be called IMF.Stat), which is based on the OECD.Stat data warehouse system.
The Data Mapper fits within a larger capital project to improve data dissemination. The IMF Data Mapper includes selected data from the WEO, the Balance of Payments Yearbook, International Financial Statistics, OECD Main Indicators, the African Regional Economic Outlook, and the Government Finance Statistics Yearbook. Other data will be added soon, including from the IMF's Global Financial Stability Reports and from other Regional Economic Outlooks.
Comments on this article should be sent to imfsurvey@imf.org