

Tunisia -- 2005 Article IV Consultation, Preliminary Conclusions of the IMF Mission
January 20, 2006
Describes the preliminary findings of IMF staff at the conclusion of certain missions (official staff visits, in most cases to member countries). Missions are undertaken as part of regular (usually annual) consultations under Article IV of the IMF's Articles of Agreement, in the context of a request to use IMF resources (borrow from the IMF), as part of discussions of staff monitored programs, and as part of other staff reviews of economic developments.
January 20, 2006
I. Introduction
1. The mission of the International Monetary Fund (IMF) that has been in Tunis since December 5, 2005 for the consultations required under Article IV of the Fund's Articles of Agreement would like to thank the Tunisian authorities for the warm welcome they have received and the quality of the discussions.
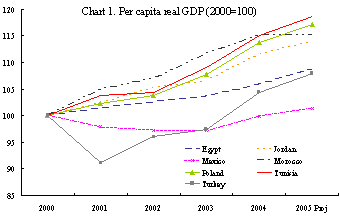 |
2. Tunisia has made significant progress toward its objective of catching up with the economic level of the lower-tier OECD countries. Real per capita income has increased by almost 20 percent since 2000, the unemployment rate continues to decline, and macroeconomic imbalances remain under control owing to the capacity of the fiscal, monetary, and exchange rate policies to respond rapidly to changing conditions and economic shocks.
3. However, all the conditions are not yet met to achieve this objective, and important economic policy challenges lie ahead. Although the growing openness of the economy and market-oriented economic policies have had good results thus far, their benefits could be eroded unless reforms are continued and deepened. An acceleration of reforms is necessary to fully integrate Tunisia into the world market, while maximizing the benefits and controlling the risks of this integration. The main challenges are:
 |
• Accelerating the annual rate of economic growth by at least 1 to 1.5 percentage points until 2010. Without this additional growth, the authorities' objective of bridging the gap between Tunisia and the OECD countries in terms of per capita income will remain elusive.
• Reducing unemployment, which increasingly affects university graduates. To achieve this, at a higher rate of growth, the economy must continue its transformation by developing the sectors that require skilled labor to respond to a growing demand for jobs from university graduates. This in turn will lead to higher productivity, the real engine for sustainable economic growth.
4. To face these challenges, reforms must be stepped up, particularly in the following four areas:
• Improvement of the business climate. The level of private investment (domestic and foreign) remains low in comparison with more dynamic emerging countries. Simple, stable, and transparent rules are essential to make Tunisia more attractive to private investment.
• Strengthening of the banking and financial sector, particularly the level of nonperforming loans, which increases the cost of credit and hampers growth and investment, while at the same time slowing progress toward full convertibility of the dinar and a more dynamic monetary policy.
• Consolidation of the macroeconomic policies needed to advance the authorities' strategy of gradually liberalizing the external capital account. This will help to take better advantage of external savings to finance a higher level of investment while monitoring macroeconomic stability.
• Liberalization of the labor market. A more flexible labor market is needed to absorb the growing supply of skilled labor and to create a climate conducive to improved productivity levels.
5. In the short term, the management of anticipated privatization receipts and potential balance of payments surpluses are the key macroeconomic challenge.
II. Short-term Outlook and Macroeconomic Policy Challenges
6. Tunisia's macroeconomic performance has been favorable and its macroeconomic policies remain appropriate overall. Real GDP growth should accelerate in 2006 with the upturn in agriculture and the increase in industrial production and activity in the construction sector. Inflation remains under control. The external position is strengthening despite the negative, albeit limited, impact of the expiration of the Agreement on Textiles and Clothing (ATC), rising oil prices on the international markets, and stagnating demand in Europe. International reserves continue to grow (to more than 3½ months of imports of goods and services). The external debt remains high1, however although it should decline considerably in 2006 given the forecast for strong growth and assuming that a portion of privatization receipts is used to reduce the external debt burden. The management of these receipts and other foreign inflows should be taken into consideration in short-term macroeconomic policies.
7. The sizable privatizations planned for 2006 are both a challenge and an opportunity on many levels. The opening of part of the capital of Tunisie Télécom would give a positive signal to the private sector and could help to further improve the country's image to foreign investors. It is important to quickly establish a clear strategy for the use of the privatization receipts, while limiting their impact on the monetary aggregates. The mission encourages the authorities to take advantage of this opportunity to reduce the external debt burden. This would improve the markets' perception of Tunisia's country risk, which could in turn lead to a decline in the interest spread on bond issues on the international markets. The choice between accumulation of reserves and repayment of the external debt should not be limited to consideration of the relative cost of refinancing but should also take into account the benefits from reduced risk.
A. Fiscal Policy
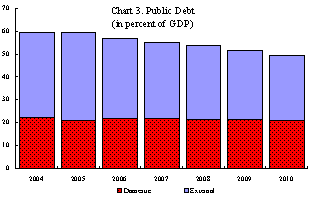 |
8. The central government fiscal deficit remains under control despite the impact of higher oil prices on subsidies and the recent increase in civil service wages. To limit this impact, the authorities continued to raise retail petroleum prices in 2005 and further increases are provided for in the 2006 budget law. In addition, measures were taken in 2005 to limit other spending and to improve revenue collection. The 2006 budget law, which is based on an oil price assumption of $60 a barrel, calls for an increase in the fiscal deficit of one-half percentage point of GDP, to 3.6 percent. However, the mission encourages the authorities to keep the deficit at 3 percent of GDP in order to achieve the target of reducing the public debt-to-GDP ratio to less than 50 percent in the medium term, from a current level of around 60 percent. This should be achievable, given the tax collection results in 2005, and the projected buoyancy of fiscal revenue. Moreover, financing of the deficit should continue to be based on domestic bond issues, despite privatization receipts, so as not to complicate monetary management.
B. Monetary and Exchange Policies
9. The Central Bank of Tunisia's (BCT) sterilization of excess liquidity helped to limit the impact of external flows on the money supply and inflation, while allowing a rate of growth of credit to the economy compatible with economic activity. The mission encourages the BCT to continue these efforts in view of any excess liquidity generated either by a partial use of privatization receipts for budgetary financing, or by other foreign financial flows. Such a policy would result in an increase in the money supply of around 10½ percent in 2006 and growth of credit to the economy of 7 percent, compatible with the anticipated level of economic activity, while keeping inflation under control. However, the mission estimates that in the event that these flows are persistent, monetary policy alone will not be sufficient. It would be essential to supplement these efforts with greater fiscal consolidation, higher levels of early external debt repayments, greater exchange rate flexibility, and more rapid liberalization of trade and finance.
10. Significant progress has been made in implementing the money targeting framework developed in cooperation with Fund staff. Base money targeting, which is the operational variable in the framework, has played a more important role in the conduct of monetary policy in 2005. The mission encourages the authorities to adopt this framework in 2006. However, it emphasizes that such a framework needs to allow for greater variations in money market interest rates within a broader band.
11. The depreciation of the real effective exchange rate has served the Tunisian economy well and supported the competitiveness of its exports. However, the mission encourages the BCT to give greater weight to market forces and allow flexibility of the exchange rate in both directions. It also encourages it to closely monitor changes in the real exchange rate and their impact on inflation.
III. Medium-Term Economic Outlook and Further Transformation of the Economy
12. The medium-term outlook reflects the government's ambitious objectives of strengthening the foundations for higher growth, which would make it possible to further reduce the unemployment rate by absorbing the growing demand for jobs from skilled workers. The mission shares the authorities' belief that achieving these goals will require further transformation of the Tunisian economy. This would require higher private investment and higher productivity. This could be achieved through (a) the new drive for reform currently under way, which aims to strengthen the financial system, improve the business climate, and enhance labor market flexibility; and (b) continued adaptation of macroeconomic policies to the constraints posed by Tunisia's integration into the world market.
13. From a quantitative point of view, the mission estimates that the authorities' growth targets (6.2 percent on average for the period 2006-10) require (a) an increase in investment of 1.4 percentage points of GDP; (b) an improvement in national savings of 1.8 percentage points of GDP, with a contribution from the government of 1.2 percentage points; and (c) gradual improvement in overall factor productivity. Foreign borrowing should decline in a context of ongoing fiscal consolidation, despite increased recourse by the private sector to external borrowing to finance its investment.
A. Strengthening of the Financial System
14. A sound, dynamic, and competitive financial sector is essential for achieving the medium-term growth and job creation goals and increasing the capacity of the Tunisian economy to weather domestic and external shocks. Although considerable progress has been made in recent years, the reforms should be continued so as to modernize and prepare the Tunisian financial system for integration into the international financial system. In particular, the high level of nonperforming loans (NPLs) acts as a constraint on the development of the financial system, the pursuit of macroeconomic reforms, and higher investment and growth.
15. In this context, the mission supports the government's strategy for improving the quality of banks' portfolios, which focuses on enhancing the credit culture, promoting good governance, and improving the legislative and judicial framework for loan recovery. In particular, it is pleased with the following measures taken by the authorities: (i) prohibition on banks to distribute dividends when they have insufficient provisions; (ii) enactment of the law to improve the security of financial relations, which aims to consolidate financial transparency and engender good corporate governance; (iii) amendment of the code of commercial and civil procedure to facilitate the court-ordered sale of assets and shorten debt collection delays; (iv) the full tax deductibility of provisions in 2006; and (v) continuation of the gradual withdrawal of the government from the banking sector with the privatization of Union Internationale des Banques and Banque du Sud. It also notes that the draft amendment to the banking law will strengthen bank governance by giving their boards of directors the means to ensure appropriate oversight over their management.
16. The consolidation and development of the financial sector will also improve the effectiveness of monetary policy, facilitate the transition to inflation targeting, and allow for progress toward the government's goal of full liberalization of capital transactions while minimizing the risks of financial instability. In this context, the amendment of the BCT charter aimed at making price stability the central bank's key objective and clarifying its role vis-à-vis the other supervisory authorities of the financial sector is encouraging.
17. However, the gradual approach taken until now has resulted in limited improvement in the prudential indicators for the banking sector. Following the increase resulting from the regional crisis in 2001, the ratio of nonperforming loans (NPLs) to total loans should decline by 2 ½ percentage points in 2005, to 21½ percent. The mission believes that it would be advisable to adopt a more vigorous approach to resolving the NPL problem, which not only increases the cost of credit, but constitute a significant source of vulnerability for the Tunisian economy. In particular, the mission encourages the authorities to: (i) strengthen the autonomy, management on a commercial basis, and governance of the government-owned banks; (ii) ensure the strict application of provisioning rules and sanctions; and (iii) accelerate the write-off of loan losses (based on the study made by the BCT on longstanding NPLs). The authorities are encouraged to consider the possibility of recapitalizing government-owned banks with a sizable impaired portfolio, after first strengthening their management and introducing safeguard measures to avoid a new accumulation of NPLs.
18. The updating of the Financial Sector Assessment Program (FSAP) in cooperation with the staffs of the IMF and World Bank scheduled for January 2006 will provide an opportunity to assess progress made since the 2001 FSAP and to define the phases that remain to be completed.
B. Strengthening of Macroeconomic Policy
External capital account liberalization
19. The continued gradual liberalization of the external capital account with a view to full convertibility of the dinar is encouraging. In particular, the mission welcomes the gradual opening of the Treasury bill market to nonresidents, the easing of conditions on borrowing abroad, and the elimination of authorizations for certain foreign investment operations. Completion of the first phase of the strategy for the liberalization of capital flows developed by the authorities in cooperation with Fund staff requires full liberalization of inward foreign direct investment.2 Progress to the next phase of this strategy, which consists of liberalizing Tunisian investments abroad and opening the economy to all foreign portfolio investment, can be achieved only after the transition to a floating exchange rate and once the financial system is sound and modern. At the same time, further progress is necessary in the conduct of monetary policy.
Monetary and exchange rate policy
20. The mission notes that it is imperative to implement money targeting, an intermediate step toward inflation targeting, given the proposed amendment of the central bank charter making price stability the key objective of the BCT.
21. A more dynamic monetary policy does, however, require developing the money and exchange markets. The resumption of short-term Treasury bill issues in March 2005 is an important step toward increasing the liquidity of the money market and building a yield curve. At the same time, the elimination of the ceiling on purchases of Treasury bills by the BCT in the draft charter of the BCT will facilitate building a securities portfolio for monetary policy operations, which should help develop the money market. Likewise, the elimination of the requirement to surrender foreign exchange proceeds and the increased use of foreign currency accounts for some categories of residents will contribute to the development of the exchange market. Nevertheless, the development of a deep and liquid exchange market requires abolishing the obligation for banks to transfer their end-of-day foreign exchange balances to the central bank (nivellement) and the elimination of exchange rate quotations by the BCT. This would give a greater role to market forces in determining the exchange rate.
22. In general, greater exchange and interest rate flexibility would provide incentives for market players to develop appropriate hedging instruments and better prepare for the transition to a floating exchange rate and complete liberalization of the capital account, both medium-term objectives of the authorities.
Fiscal reform
23. The mission encourages the authorities to step up the fiscal reforms necessary for achieving the objective of reducing the public debt burden. This objective is important for further increasing fiscal policy flexibility and limiting the risks involved in the transition to full convertibility of the dinar and a floating exchange rate. On the revenue side, the tax legislation should be simplified, exemptions and other tax incentives should be limited, and the tax administration should be modernized in line with the recommendations of the technical assistance provided by the IMF Fiscal Affaires Department. The mission welcomes the authorities' intention of implementing the following reforms: (i) expansion of the corporate income tax base and reduction of its rates; (ii) simplification of the VAT by reducing the number of rates; (iii) revision of tax incentives and closer alignment of on-shore/off-shore regimes; and (iv) reorganization of the tax administration to enhance its effectiveness and improve services to taxpayers. In this regard, efforts to computerize processes and the plan to create a large taxpayer unit are very positive developments. On the expenditure side, the authorities' strategy for more efficient energy use and the decision to gradually eliminate subsidies on the consumption of petroleum products and to liberalize their prices by 2008 should contribute to fiscal consolidation. To control the wage bill, the mission encourages the authorities to limit new hiring, pointing out that expanding civil service jobs is not a sustainable solution to the problem of unemployment among graduates.
C. Improvement in the Business Climate
24. A more dynamic private sector is essential for moving Tunisia to a path of higher growth in an increasingly competitive international environment. In this context, improving the business climate is key to increasing the level and quality of private investment. Accelerating the liberalization of international trade at the multilateral level and continuing the customs reform would help to reduce firms' cost of production. The mission welcomes the authorities' interest in receiving technical assistance for customs reform. The elimination of some tax rules, such as the limits on reimbursement of VAT credits and withholding at the source, would help to eliminate distortions and complications for companies and improve relations between the private sector and the administration. More generally, it is important to further simplify administrative procedures. The mission encourages the authorities to continue to work toward these objectives in cooperation with the World Bank, the European Union, and the African Development Bank in the context of ECAL IV.
D. Increased Labor Market Flexibility
25. The mission encourages the authorities to continue to enhance labor market flexibility with a view to raising the growth rate of real GDP. In its view, such a reform would facilitate the reallocation of labor in response to structural changes in the economy and would encourage the creation of skilled jobs and thus increase productivity. Greater labor market flexibility would also help to reduce the impact of the expiration of the ATC on employment in the medium term.
26. The mission is pleased with the active policies of the authorities to align the supply and demand for jobs and the reforms aimed at enhancing labor market flexibility at the recruitment level (temporary jobs). However, it believes that introducing such flexibility without easing complex regulations and procedures governing dismissals could hamper the creation of permanent jobs. It suggests that discussions be started on the easing of regulations on dismissals.
IV. Miscellaneous Issues
27. The mission congratulates the authorities for their efforts to increase economic policy transparency as exemplified by their customary agreement to the publication of the mission's preliminary conclusions and the final report on the consultations, and to the holding of a press conference by the mission.
28. The mission is pleased with Tunisia's participation in the conference on trade facilitation among Algeria, Morocco and Tunisia and underscores the importance of continuing economic integration in the Maghreb region.
29. The mission welcomes the finalization of the Report on the Observance of Standards and Codes (ROSC)—Data Module.
30. It was agreed that the next discussions for the Article IV Consultations would take place on a 12-month cycle.
| Table 1. Tunisia: Selected Economic and Financial Indicators, 2003-2010 | ||||||||
| Est. | Proj. | Proj. | Proj. | Proj. | Proj. | Proj. | ||
| 2003 | 2004 | 2005 | 2006 | 2007 | 2008 | 2009 | 2010 | |
|
Production and income (percent change) |
||||||||
|
Nominal GDP |
7.6 | 8.8 | 6.2 | 9.0 | 8.4 | 8.5 | 8.6 | 8.7 |
|
Real GDP |
5.6 | 6.0 | 4.2 | 5.8 | 6.0 | 6.2 | 6.4 | 6.5 |
|
GDP deflator |
2.0 | 2.6 | 1.9 | 3.1 | 2.3 | 2.2 | 2.1 | 2.1 |
|
Consumer price index (CPI), average |
2.8 | 3.6 | 2.0 | 2.9 | 2.0 | 2.0 | 2.0 | 2.0 |
|
Gross national savings (in percent of GDP) |
22.0 | 21.9 | 22.1 | 21.7 | 22.3 | 22.7 | 23.0 | 23.5 |
|
Gross investment (in percent of GDP) |
25.1 | 24.2 | 23.9 | 23.5 | 24.0 | 24.4 | 24.7 | 25.1 |
|
External sector (percent change) |
||||||||
|
Exports of goods, f.o.b. (in $) |
17.1 | 20.6 | 8.6 | 4.2 | 4.4 | 4.8 | 5.4 | 5.8 |
|
Imports of goods, f.o.b. (in $) |
14.7 | 17.6 | 5.6 | 3.7 | 4.1 | 4.4 | 5.1 | 5.4 |
|
Exports of goods, f.o.b. (volume) |
7.2 | 10.6 | 1.3 | 2.3 | 3.6 | 4.5 | 4.9 | 4.9 |
|
Import of goods, f.o.b. (volume) |
3.4 | 7.3 | -2.6 | 2.0 | 4.0 | 4.8 | 4.9 | 4.6 |
|
Trade balance (in percent of GDP) |
-9.1 | -8.7 | -7.9 | -7.8 | -7.5 | -7.2 | -6.9 | -6.6 |
|
Current account, excl. grants (in percent of GDP) |
-2.9 | -2.0 | -1.8 | -1.8 | -1.7 | -1.7 | -1.7 | -1.6 |
|
Foreign direct investment (percent of GDP) |
2.2 | 2.2 | 2.3 | 5.9 | 2.2 | 2.2 | 2.2 | 2.2 |
|
Terms of trade (deterioration -) |
-1.5 | -0.5 | ... | ... | ... | ... | ... | ... |
|
Real effective exchange rate (depreciation -) 1/ |
-4.1 | -3.9 | ... | ... | ... | ... | ... | ... |
|
Central government (percent of GDP, unless otherwise indicated) 2/ |
||||||||
|
Total revenue, excluding grants and privatization |
23.6 | 23.9 | 23.9 | 23.6 | 23.4 | 23.2 | 23.2 | 23.1 |
|
Total expenditure and net lending |
27.0 | 26.8 | 27.0 | 26.6 | 26.0 | 25.5 | 25.0 | 25.0 |
|
Central government balance, excl. grants and privatization |
-3.4 | -2.9 | -3.1 | -3.0 | -2.7 | -2.3 | -1.9 | -1.8 |
|
Central government balance, incl. grants, excl. privatization |
-3.2 | -2.6 | -2.9 | -2.8 | -2.5 | -2.1 | -1.7 | -1.7 |
|
Total government debt (foreign and domestic) |
60.4 | 59.7 | 60.3 | 56.6 | 55.1 | 53.3 | 51.1 | 48.9 |
|
Foreign currency public debt (percent of total debt) |
64.4 | 63.2 | 64.2 | 62.4 | 60.5 | 60.2 | 59.1 | 57.6 |
|
Money and credit (percent change) |
||||||||
|
Credit to the economy |
4.6 | 5.3 | 7.5 | 7.0 | ... | ... | ... | ... |
|
Broad money (M3) 3/ |
6.3 | 10.3 | 9.2 | 10.4 | ... | ... | ... | ... |
|
Velocity of circulation (GDP/M3) |
1.66 | 1.63 | 1.59 | 1.57 | ... | ... | ... | ... |
|
Interest rate (money market rate, in percent, e.o.p) |
5.00 | 5.00 | ... | ... | ... | ... | ... | ... |
|
Official reserves |
||||||||
|
Gross official reserves (US$ billions, e.o.p) |
3.0 | 4.0 | 4.4 | 5.2 | 5.6 | 6.3 | 6.7 | 7.0 |
|
In months of imports of goods & services, c.i.f. |
3.0 | 3.5 | 3.6 | 4.1 | 4.2 | 4.5 | 4.5 | 4.5 |
|
Total external debt |
||||||||
|
External debt (US$ billions) |
17.9 | 19.8 | 19.2 | 19.3 | 19.9 | 20.7 | 21.3 | 21.7 |
|
External debt (in percent of GDP) |
67.2 | 67.8 | 69.5 | 66.2 | 63.5 | 61.4 | 58.5 | 55.4 |
|
Debt service ratio (percent of exports of GNFS) |
15.1 | 16.2 | 15.6 | 17.3 | 15.9 | 14.5 | 15.6 | 15.7 |
|
Memorandum items: |
||||||||
|
GDP at current prices (TD millions) |
32,212 | 35,035 | 37,202 | 40,565 | 43,973 | 47,699 | 51,806 | 56,312 |
|
GDP at current prices (US$ billions) |
25.0 | 28.1 | 28.8 | 29.6 | 31.5 | 33.9 | 36.5 | 39.4 |
|
GDP per capita (US$) |
2,531 | 2,833 | 2,867 | 2,904 | 3,049 | 3,239 | 3,446 | 3,667 |
|
Unemployment rate ( in percent) |
14.3 | 13.9 | ... | ... | ... | ... | ... | ... |
|
Population (millions) |
9.9 | 9.9 | 10.1 | 10.2 | 10.3 | 10.5 | 10.6 | 10.7 |
|
Poverty rate (World Bank, "core poverty", 2000) |
4.1 | ... | ... | ... | ... | ... | ... | ... |
|
Exchange rate: dinar/US$ (average) |
1.29 | 1.25 | ... | ... | ... | ... | ... | ... |
|
Sources: Tunisian authorities; and Fund staff estimates and projections. 1/ Information Notice System 2/ Excludes the social security accounts. 3/ Financial system (Deposit money banks and Development banks). | ||||||||
| Table 2. Tunisia: Balance of Payments, 2003-2010 | ||||||||
| (In millions of U.S. dollars) | ||||||||
| Est. | Proj. | Proj. | Proj. | Proj. | Proj. | Proj. | ||
| 2003 | 2004 | 2005 | 2006 | 2007 | 2008 | 2009 | 2010 | |
|
Current account |
-730 | -554 | -533 | -531 | -533 | -574 | -605 | -640 |
|
Trade balance |
-2,270 | -2,434 | -2,279 | -2,313 | -2,374 | -2,435 | -2,518 | -2,605 |
|
Exports |
8,027 | 9,679 | 10,510 | 10,956 | 11,438 | 11,989 | 12,635 | 13,371 |
|
Energy |
801 | 924 | 1,355 | 1,569 | 1,637 | 1,630 | 1,650 | 1,678 |
|
Non-energy |
7,226 | 8,755 | 9,156 | 9,386 | 9,801 | 10,359 | 10,985 | 11,693 |
|
Imports |
-10,297 | -12,113 | -12,790 | -13,268 | -13,812 | -14,424 | -15,153 | -15,976 |
|
Energy |
-1,130 | -1,331 | -1,905 | -2,186 | -2,257 | -2,227 | -2,232 | -2,248 |
|
Non-energy |
-9,166 | -10,782 | -10,885 | -11,083 | -11,555 | -12,198 | -12,920 | -13,728 |
|
Services and Transfers (net) |
1,539 | 1,880 | 1,747 | 1,782 | 1,842 | 1,861 | 1,913 | 1,965 |
|
Nonfactor |
1,362 | 1,679 | 1,736 | 1,724 | 1,736 | 1,756 | 1,770 | 1,784 |
|
o/w Tourism |
1,477 | 1,839 | 1,988 | 2,023 | 2,087 | 2,170 | 2,255 | 2,343 |
|
Factor Services and Transfers (net) |
177 | 201 | 10 | 58 | 106 | 106 | 143 | 181 |
|
o/w Workers' remittances |
1,250 | 1,431 | 1,451 | 1,460 | 1,522 | 1,588 | 1,654 | 1,722 |
|
o/w Interest payments on external debt |
-572 | -641 | -755 | -809 | -824 | -851 | -886 | -910 |
|
Capital and financial account |
1,115 | 1,528 | 1,031 | 1,385 | 942 | 1,215 | 1,018 | 938 |
|
Excluding grants |
1,049 | 1,415 | 914 | 1,276 | 835 | 1,109 | 913 | 833 |
|
Capital account |
59 | 107 | 111 | 104 | 102 | 101 | 101 | 100 |
|
Financial account |
1,056 | 1,421 | 920 | 1,281 | 840 | 1,114 | 918 | 838 |
|
Direct foreign investment (net) |
553 | 616 | 674 | 1,750 | 699 | 753 | 813 | 877 |
|
Medium and long term loans (net) |
823 | 947 | 585 | -204 | 320 | 518 | 295 | 187 |
|
Disbursement |
1,891 | 2,437 | 2,044 | 1,532 | 1,932 | 2,002 | 2,043 | 2,075 |
|
Amortization |
-1,068 | -1,490 | -1,459 | -1,736 | -1,612 | -1,484 | -1,749 | -1,888 |
|
Short term capital |
-289 | -103 | -339 | -265 | -179 | -158 | -190 | -226 |
|
Errors and omissions |
-32 | -39 | 0 | 0 | 0 | 0 | 0 | 0 |
|
Overall balance |
385 | 974 | 498 | 854 | 410 | 641 | 414 | 298 |
|
Changes in gross reserves 1/ |
-653 | -1033 | -347 | -844 | -410 | -638 | -408 | -292 |
|
Use of IMF resources |
0 | 0 | 0 | 0 | 0 | 0 | 0 | 0 |
|
Other assets, net (increase -) |
-653 | -1033 | -347 | -844 | -410 | -638 | -408 | -292 |
|
Memorandum items: |
||||||||
|
Current account balance/GDP (in percent) |
-2.9 | -2.0 | -1.8 | -1.8 | -1.7 | -1.7 | -1.7 | -1.6 |
|
Reserves (in billions of $) |
3.0 | 4.0 | 4.4 | 5.2 | 5.6 | 6.3 | 6.7 | 7.0 |
|
Reserves in months of imports of goods |
3.3 | 3.8 | 3.9 | 4.5 | 4.6 | 4.9 | 5.0 | 4.9 |
|
Reserves in months of imports of goods &services |
3.0 | 3.5 | 3.6 | 4.1 | 4.2 | 4.5 | 4.5 | 4.5 |
|
External medium-and long-term debt (in billions of $) |
14.4 | 16.0 | 15.6 | 15.5 | 16.0 | 16.7 | 17.1 | 17.4 |
|
External medium-and long-term debt/GDP (in percent) |
53.9 | 54.9 | 56.6 | 53.3 | 51.2 | 49.5 | 47.1 | 44.4 |
|
External Short-term debt (in billions of $) |
3.6 | 3.8 | 3.6 | 3.7 | 3.9 | 4.0 | 4.1 | 4.3 |
|
External short-term debt/GDP (in percent) |
13.3 | 12.9 | 13.0 | 12.8 | 12.3 | 11.9 | 11.4 | 11.0 |
|
Debt Service Ratio (as percent XGS, incl IMF) |
15.1 | 16.2 | 15.6 | 17.3 | 15.9 | 14.5 | 15.6 | 15.7 |
|
Real goods export growth (in percent) |
7.2 | 10.6 | 1.3 | 2.3 | 3.6 | 4.5 | 4.9 | 4.9 |
|
Non-energy |
5.4 | 10.4 | 0.9 | 2.2 | 3.7 | 4.8 | 5.2 | 5.2 |
|
Real goods import growth (in percent) |
3.4 | 7.3 | -2.6 | 2.0 | 4.0 | 4.8 | 4.9 | 4.6 |
|
Non-energy |
0.6 | 7.8 | -3.2 | 1.9 | 4.3 | 5.2 | 5.3 | 5.0 |
|
Sources: Tunisian authorities; and Fund staff estimates and projections. 1/ Differs from the overall balance because of valuation effects. | ||||||||
|
Table 3. Tunisia: Central Government Financial Operations, 2004-2010 1/ | |||||||||
| Est. | LdF compl | Proj. | LdF | Projections | |||||
| 2004 | 2005 | 2005 | 2006 | 2006 | 2007 | 2008 | 2009 | 2010 | |
|
Total revenue and grants and privatization |
8,577 | 9,019 | 9,149 | 9,640 | 11,157 | 10,502 | 11,318 | 12,243 | 13,241 |
|
Total revenue |
8,379 | 8,799 | 8,899 | 9,396 | 9,563 | 10,273 | 11,089 | 12,014 | 13,012 |
|
Tax revenue |
7,253 | 7,770 | 7,870 | 8,282 | 8,441 | 9,131 | 9,898 | 10,772 | 11,719 |
|
direct taxes |
2,385 | 2,769 | 2,819 | 3,022 | 3,041 | 3,308 | 3,600 | 3,962 | 4,307 |
|
trade taxes |
557 | 535 | 535 | 560 | 563 | 549 | 537 | 525 | 513 |
|
VAT |
2,257 | 2,302 | 2,302 | 2,488 | 2,524 | 2,792 | 3,076 | 3,399 | 3,764 |
|
domestic |
1,139 | 1,132 | 1,132 | 1,226 | 1,234 | 1,404 | 1,595 | 1,810 | 2,051 |
|
imports |
1,119 | 1,170 | 1,170 | 1,262 | 1,290 | 1,388 | 1,481 | 1,589 | 1,713 |
|
excise |
1,150 | 1,208 | 1,208 | 1,290 | 1,323 | 1,411 | 1,525 | 1,627 | 1,769 |
|
domestic |
700 | 743 | 743 | 794 | 810 | 866 | 952 | 1,021 | 1,124 |
|
imports |
451 | 466 | 466 | 496 | 513 | 545 | 573 | 607 | 645 |
|
other taxes |
904 | 956 | 1,006 | 922 | 989 | 1,071 | 1,160 | 1,259 | 1,366 |
|
domestic |
842 | 908 | 958 | 870 | 936 | 1,015 | 1,101 | 1,196 | 1,300 |
|
imports |
62 | 48 | 48 | 52 | 53 | 56 | 59 | 63 | 67 |
|
Nontax revenue |
1,117 | 1,022 | 1,022 | 1,106 | 1,114 | 1,142 | 1,191 | 1,241 | 1,293 |
|
Capital income |
9 | 7 | 7 | 8 | 8 | 0 | 0 | 0 | 0 |
|
Total expenditure and net lending |
9,378 | 10,158 | 10,058 | 10,831 | 10,780 | 11,453 | 12,165 | 12,975 | 14,050 |
|
Total expenditure |
9,411 | 10,111 | 10,011 | 10,783 | 10,732 | 11,405 | 12,117 | 12,927 | 14,002 |
|
Current expenditure |
6,983 | 7,674 | 7,574 | 8,302 | 8,289 | 8,736 | 9,198 | 9,718 | 10,499 |
|
Wages and salaries |
4,222 | 4,573 | 4,573 | 4,898 | 4,898 | 5,310 | 5,760 | 6,256 | 6,800 |
|
Goods and services |
699 | 658 | 658 | 676 | 670 | 770 | 835 | 907 | 986 |
|
Interest payments |
989 | 1,067 | 1,067 | 1,150 | 1,150 | 1,184 | 1,269 | 1,337 | 1,405 |
|
domestic |
418 | 470 | 470 | 521 | 521 | 560 | 620 | 656 | 701 |
|
external |
571 | 597 | 597 | 629 | 629 | 624 | 649 | 681 | 703 |
|
Transfers and subsidies |
1,073 | 1,313 | 1,213 | 1,442 | 1,451 | 1,472 | 1,334 | 1,218 | 1,308 |
|
CGC |
200 | 248 | 248 | 258 | 258 | 268 | 278 | 288 | 298 |
|
Petroleum subsidies |
203 | 508 | 408 | 500 | 500 | 415 | 200 | 0 | 0 |
|
Other |
670 | 557 | 557 | 684 | 693 | 789 | 856 | 930 | 1,010 |
|
Other expenditure (non allocated) |
0 | 63 | 63 | 136 | 120 | 0 | 0 | 0 | 0 |
|
Capital expenditure |
2,428 | 2,437 | 2,437 | 2,481 | 2,442 | 2,670 | 2,920 | 3,210 | 3,503 |
|
Direct investment |
1,346 | 1,337 | 1,337 | 1,379 | 1,388 | 1,591 | 1,750 | 1,940 | 2,122 |
|
Capital transfers and equity |
1,082 | 1,014 | 1,014 | 988 | 995 | 1,078 | 1,170 | 1,270 | 1,381 |
|
Other expenditure (non allocated) |
0 | 86 | 86 | 114 | 60 | 0 | 0 | 0 | 0 |
|
Net lending |
-33 | 48 | 48 | 48 | 48 | 48 | 48 | 48 | 48 |
|
Central Govt deficit (-), excl grants and privatization |
-999 | -1,360 | -1,160 | -1,435 | -1,217 | -1,181 | -1,076 | -962 | -1,038 |
|
Grants |
73 | 85 | 85 | 94 | 94 | 94 | 94 | 94 | 94 |
|
Privatization Proceeds |
125 | 135 | 165 | 150 | 1500 | 135 | 135 | 135 | 135 |
|
Central Govt deficit (-), incl grants and privatization |
-801 | -1,140 | -910 | -1,191 | 377 | -952 | -847 | -733 | -809 |
|
Financing |
801 | 1,140 | 910 | 1,191 | -377 | 952 | 847 | 733 | 809 |
|
Foreign |
207 | 482 | 463 | -106 | -679 | 85 | 361 | 113 | 24 |
|
Domestic |
595 | 658 | 446 | 1,297 | 302 | 867 | 486 | 620 | 785 |
|
Memorandum items: |
|||||||||
|
Balance of the central Gov., (including grants, excl priv) |
-926 | -1,275 | -1,075 | -1,341 | -1,123 | -1,087 | -982 | -868 | -944 |
|
Central government primary balance |
188 | -73 | 157 | -41 | 1,527 | 232 | 422 | 604 | 596 |
|
Central govt primary balance (excl grants and priv.) |
-10 | -293 | -93 | -285 | -67 | 3 | 193 | 375 | 367 |
|
General government debt 2/ |
20,916 | 22,616 | 22,429 | 24,357 | 22,952 | 24,242 | 25,413 | 26,449 | 27,557 |
|
o/w domestic |
7,707 | 8,530 | 8,039 | 9,958 | 8,638 | 9,567 | 10,123 | 10,821 | 11,692 |
|
external |
13,209 | 14,086 | 14,390 | 14,399 | 14,314 | 14,676 | 15,290 | 15,628 | 15,864 |
|
Nominal GDP |
35,035 | 37,202 | 37,202 | 40,305 | 40,565 | 43,973 | 47,699 | 51,806 | 56,312 |
|
Nominal nonagricultural GDP |
30,585 | 32,868 | 32,868 | 36,034 | 36,034 | 39,167 | 42,600 | 46,397 | 50,574 |
|
Oil price ($/barrel) |
37.8 | 56.6 | 53.4 | 60.0 | 60.0 | 60.8 | 58.8 | 57.8 | 57.0 |
|
Imports |
15,087 | 16,499 | 16,499 | 18,192 | 18,192 | 19,302 | 20,315 | 21,504 | 22,862 |
|
Total revenue and grants and privatization |
24.5 | 24.2 | 24.6 | 23.9 | 27.5 | 23.9 | 23.7 | 23.6 | 23.5 |
|
Total revenue |
23.9 | 23.7 | 23.9 | 23.3 | 23.6 | 23.4 | 23.2 | 23.2 | 23.1 |
|
Tax revenue |
20.7 | 20.9 | 21.2 | 20.5 | 20.8 | 20.8 | 20.8 | 20.8 | 20.8 |
|
direct taxes |
6.8 | 7.4 | 7.6 | 7.5 | 7.5 | 7.5 | 7.5 | 7.6 | 7.6 |
|
trade taxes |
1.6 | 1.4 | 1.4 | 1.4 | 1.4 | 1.2 | 1.1 | 1.0 | 0.9 |
|
trade taxes |
3.7 | 3.2 | 3.2 | 3.1 | 3.1 | 2.8 | 2.6 | 2.4 | 2.2 |
|
VAT |
6.4 | 6.2 | 6.2 | 6.2 | 6.2 | 6.3 | 6.4 | 6.6 | 6.7 |
|
domestic |
3.3 | 3.0 | 3.0 | 3.0 | 3.0 | 3.2 | 3.3 | 3.5 | 3.6 |
|
imports |
3.2 | 3.1 | 3.1 | 3.1 | 3.2 | 3.2 | 3.1 | 3.1 | 3.0 |
|
imports |
7.4 | 7.1 | 7.1 | 6.9 | 7.1 | 7.2 | 7.3 | 7.4 | 7.5 |
|
excise |
3.3 | 3.2 | 3.2 | 3.2 | 3.3 | 3.2 | 3.2 | 3.1 | 3.1 |
|
domestic |
2.0 | 2.0 | 2.0 | 2.0 | 2.0 | 2.0 | 2.0 | 2.0 | 2.0 |
|
imports |
1.3 | 1.3 | 1.3 | 1.2 | 1.3 | 1.2 | 1.2 | 1.2 | 1.1 |
|
imports |
3.0 | 2.8 | 2.8 | 2.7 | 2.8 | 2.8 | 2.8 | 2.8 | 2.8 |
|
other taxes |
2.6 | 2.6 | 2.7 | 2.3 | 2.4 | 2.4 | 2.4 | 2.4 | 2.4 |
|
domestic |
2.4 | 2.4 | 2.6 | 2.2 | 2.3 | 2.3 | 2.3 | 2.3 | 2.3 |
|
imports |
0.2 | 0.1 | 0.1 | 0.1 | 0.1 | 0.1 | 0.1 | 0.1 | 0.1 |
|
imports |
0.4 | 0.3 | 0.3 | 0.3 | 0.3 | 0.3 | 0.3 | 0.3 | 0.3 |
|
Nontax revenue |
3.2 | 2.7 | 2.7 | 2.7 | 2.7 | 2.6 | 2.5 | 2.4 | 2.3 |
|
Capital income |
0.0 | 0.0 | 0.0 | 0.0 | 0.0 | 0.0 | 0.0 | 0.0 | 0.0 |
|
Total expenditure and net lending |
26.8 | 27.3 | 27.0 | 26.9 | 26.6 | 26.0 | 25.5 | 25.0 | 25.0 |
|
Total expenditure |
26.9 | 27.2 | 26.9 | 26.8 | 26.5 | 25.9 | 25.4 | 25.0 | 24.9 |
|
Current expenditure |
19.9 | 20.6 | 20.4 | 20.6 | 20.4 | 19.9 | 19.3 | 18.8 | 18.6 |
|
Wages and salaries |
12.1 | 12.3 | 12.3 | 12.2 | 12.1 | 12.1 | 12.1 | 12.1 | 12.1 |
|
Goods and services |
2.0 | 1.8 | 1.8 | 1.7 | 1.7 | 1.8 | 1.8 | 1.8 | 1.8 |
|
Interest payments |
2.8 | 2.9 | 2.9 | 2.9 | 2.8 | 2.7 | 2.7 | 2.6 | 2.5 |
|
domestic |
1.2 | 1.3 | 1.3 | 1.3 | 1.3 | 1.3 | 1.3 | 1.3 | 1.2 |
|
external |
1.6 | 1.6 | 1.6 | 1.6 | 1.6 | 1.4 | 1.4 | 1.3 | 1.2 |
|
Transfers and subsidies |
3.1 | 3.5 | 3.3 | 3.6 | 3.6 | 3.3 | 2.8 | 2.4 | 2.3 |
|
CGC |
0.6 | 0.7 | 0.7 | 0.6 | 0.6 | 0.6 | 0.6 | 0.6 | 0.5 |
|
Petroleum subsidies |
0.6 | 1.4 | 1.1 | 1.2 | 1.2 | 0.9 | 0.4 | 0.0 | 0.0 |
|
Other |
1.9 | 1.5 | 1.5 | 1.7 | 1.7 | 1.8 | 1.8 | 1.8 | 1.8 |
|
Other expenditure (non allocated) |
0.0 | 0.2 | 0.2 | 0.3 | 0.3 | 0.0 | 0.0 | 0.0 | 0.0 |
|
Capital expenditure |
6.9 | 6.6 | 6.6 | 6.2 | 6.0 | 6.1 | 6.1 | 6.2 | 6.2 |
|
Direct investment |
3.8 | 3.6 | 3.6 | 3.4 | 3.4 | 3.6 | 3.7 | 3.7 | 3.8 |
|
Capital transfers and equity |
3.1 | 2.7 | 2.7 | 2.5 | 2.5 | 2.5 | 2.5 | 2.5 | 2.5 |
|
Other expenditure (non allocated) |
0.0 | 0.2 | 0.2 | 0.3 | 0.1 | 0.0 | 0.0 | 0.0 | 0.0 |
|
Net lending |
-0.1 | 0.1 | 0.1 | 0.1 | 0.1 | 0.1 | 0.1 | 0.1 | 0.1 |
|
Central Govt deficit (-), excl grants and privatization |
-2.9 | -3.7 | -3.1 | -3.6 | -3.0 | -2.7 | -2.3 | -1.9 | -1.8 |
|
Grants |
0.2 | 0.2 | 0.2 | 0.2 | 0.2 | 0.2 | 0.2 | 0.2 | 0.2 |
|
Privatization Proceeds |
0.4 | 0.4 | 0.4 | 0.4 | 3.7 | 0.3 | 0.3 | 0.3 | 0.2 |
|
Central Govt deficit (-), incl grants and privatization |
-2.3 | -3.1 | -2.4 | -3.0 | 0.9 | -2.2 | -1.8 | -1.4 | -1.4 |
|
Financing |
2.3 | 3.1 | 2.4 | 3.0 | -0.9 | 2.2 | 1.8 | 1.4 | 1.4 |
|
Foreign |
0.6 | 1.3 | 1.2 | -0.3 | -1.7 | 0.2 | 0.8 | 0.2 | 0.0 |
|
Domestic |
1.7 | 1.8 | 1.2 | 3.2 | 0.7 | 2.0 | 1.0 | 1.2 | 1.4 |
|
Memorandum items: |
|||||||||
|
Balance of the central Gov., (including grants, excl priv) |
-2.6 | -3.4 | -2.9 | -3.3 | -2.8 | -2.5 | -2.1 | -1.7 | -1.7 |
|
Central government primary balance |
0.5 | -0.2 | 0.4 | -0.1 | 3.8 | 0.5 | 0.9 | 1.2 | 1.1 |
|
Central govt primary balance (excl grants and priv.) |
0.0 | -0.8 | -0.2 | -0.7 | -0.2 | 0.0 | 0.4 | 0.7 | 0.7 |
|
General government debt 2/ |
59.7 | 60.8 | 60.3 | 60.4 | 56.6 | 55.1 | 53.3 | 51.1 | 48.9 |
|
o/w domestic |
22.0 | 22.9 | 21.6 | 24.7 | 21.3 | 21.8 | 21.2 | 20.9 | 20.8 |
external |
37.7 | 37.9 | 38.7 | 35.7 | 35.3 | 33.4 | 32.1 | 30.2 | 28.2 |
|
Sources: Tunisian authorities; and Fund staff estimates and projections. | |||||||||
| Table 4. Tunisia. Monetary Survey (Financial System), 2002-06 | ||||||||
| 2002 | 2003 | 2004 | 2005 | 2006 | ||||
|
Foreign assets (net) |
1,909 | 2,279 | 3,126 | 4,049 | 5,348 | |||
|
Foreign assets |
4,154 | 4,547 | 5,802 | 6,963 | 8,356 | |||
|
BCT |
3,134 | 3,629 | 4,843 | 5,918 | 7,278 | |||
|
Foreign liabilities |
-2,246 | -2,268 | -2,675 | -2,914 | -3,007 | |||
|
Net Domestic Assets |
16,392 | 17,178 | 18,340 | 19,396 | 20,541 | |||
|
Domestic credit |
23,744 | 24,669 | 26,366 | 28,354 | 30,348 | |||
|
Credit to the government (net) |
2,790 | 2,758 | 3,283 | 3,544 | 3,800 | |||
|
Central bank net credit |
-290 | -504 | -597 | -478 | -478 | |||
|
Commercial banks |
1,642 | 1,746 | 2,180 | 2,189 | 2,444 | |||
|
Credit to the economy |
20,954 | 21,911 | 23,084 | 24,809 | 26,549 | |||
|
Other items (net) |
-7,352 | -7,491 | -8,026 | -8,958 | -9,807 | |||
|
Money plus quasi-money (M2) |
16,681 | 17,859 | 19,846 | 21,674 | 23,936 | |||
|
Money (M1) |
6,618 | 6,992 | 7,686 | 8,394 | 9,269 | |||
|
Currency |
2,518 | 2,663 | 2,968 | 3,241 | 3,580 | |||
|
Demand deposits |
4,100 | 4,328 | 4,718 | 5,152 | 5,690 | |||
|
Quasi-money |
10,063 | 10,868 | 12,161 | 13,281 | 14,666 | |||
|
Long-term deposits (M3-M2) |
1,619 | 1,598 | 1,620 | 1,770 | 1,954 | |||
|
Broad Money (M3 ) 1/ |
18,301 | 19,457 | 21,467 | 23,444 | 25,890 | |||
| (Annual rate of change in percent) | ||||||||
|
Foreign assets (net) |
19.5 | 19.4 | 37.2 | 29.5 | 32.1 | |||
|
Domestic credit |
6.4 | 3.9 | 6.9 | 7.5 | 7.0 | |||
|
Credit to Government (net) |
4.4 | -1.2 | 19.0 | 8.0 | 7.2 | |||
|
Credit to the economy |
6.7 | 4.6 | 5.3 | 7.5 | 7.0 | |||
|
Money and quasi-money (M2) |
3.9 | 7.1 | 11.1 | 9.2 | 10.4 | |||
|
Broad Money (M3 ) |
5.2 | 6.3 | 10.3 | 9.2 | 10.4 | |||
| (Changes in percent of initial stock of M3) | ||||||||
|
Foreign assets (net) |
1.8 | 2.0 | 4.4 | 4.3 | 5.5 | |||
|
Domestic credit |
8.2 | 5.1 | 8.7 | 9.3 | 8.5 | |||
|
Credit to the government (net) |
0.7 | -0.2 | 2.7 | 1.2 | 1.1 | |||
|
Credit to the economy |
7.6 | 5.2 | 6.0 | 8.0 | 7.4 | |||
|
Other items (net) |
-4.9 | -0.8 | -2.8 | -4.3 | -3.6 | |||
|
Memorandum items: |
||||||||
|
Velocity (GDP/M3) |
1.64 | 1.66 | 1.63 | 1.59 | 1.57 | |||
|
Multiplier (M3/M0) |
5.70 | 5.74 | 5.65 | 5.81 | 5.33 | |||
|
GDP |
29,933 | 32,212 | 35,035 | 37,202 | 40,565 | |||
|
Nominal GDP growth |
4.1 | 7.6 | 8.8 | 6.2 | 9.0 | |||
|
Sources: Tunisian authorities; and Fund staff estimates and projections. | ||||||||
| Table 5. Tunisia: Medium-Term Growth Scenario, 2003-10 | ||||||||
| 2003 | 2004 | 2005 | 2006 | 2007 | 2008 | 2009 | 2010 | |
|
Real GDP growth |
5.6 | 6.0 | 4.2 | 5.8 | 6.0 | 6.2 | 6.4 | 6.5 |
|
Agriculture |
21.5 | 10.1 | -5.0 | 3.0 | 4.0 | 4.0 | 4.0 | 4.0 |
|
Nonagriculture |
3.6 | 5.4 | 5.6 | 6.2 | 6.3 | 6.5 | 6.7 | 6.8 |
|
Unemployment rate |
14.3 | 13.9 | 13.3 | 12.6 | 12.0 | 11.3 | 10.7 | 10.0 |
|
Inflation |
2.8 | 3.6 | 2.0 | 2.9 | 2.0 | 2.0 | 2.0 | 2.0 |
|
Real export growth 1/ |
0.1 | 7.8 | 2.2 | 3.1 | 3.6 | 4.2 | 4.5 | 4.5 |
|
Gross national savings |
22.0 | 21.9 | 22.1 | 21.7 | 22.3 | 22.7 | 23.0 | 23.5 |
|
Consolidated government 2/ |
4.0 | 4.5 | 3.8 | 3.4 | 3.6 | 4.1 | 4.6 | 4.6 |
|
Rest of the economy |
17.9 | 17.4 | 18.3 | 18.3 | 18.7 | 18.6 | 18.5 | 18.9 |
|
Gross investment |
25.1 | 24.2 | 23.9 | 23.5 | 24.0 | 24.4 | 24.7 | 25.1 |
|
Consolidated government |
7.2 | 7.0 | 6.6 | 6.1 | 6.1 | 6.2 | 6.3 | 6.3 |
|
Rest of the economy |
17.9 | 17.2 | 17.3 | 17.4 | 17.9 | 18.2 | 18.4 | 18.8 |
|
Savings-investment gap |
-3.2 | -2.2 | -1.8 | -1.8 | -1.7 | -1.7 | -1.7 | -1.6 |
|
Consolidated government |
-3.1 | -2.5 | -2.8 | -2.7 | -2.5 | -2.1 | -1.7 | -1.7 |
|
Rest of the economy |
0.0 | 0.3 | 1.0 | 0.9 | 0.8 | 0.4 | 0.0 | 0.1 |
|
Memorandum items: |
||||||||
|
Balance of the consolidated government |
-3.1 | -2.5 | -2.8 | -2.7 | -2.5 | -2.1 | -1.7 | -1.7 |
|
External current account |
-3.2 | -2.2 | -1.8 | -1.8 | -1.7 | -1.7 | -1.7 | -1.6 |
|
Gross fixed capital formation |
23.4 | 22.6 | 22.6 | 22.2 | 22.7 | 23.1 | 23.4 | 23.8 |
|
Sources: Tunisian authorities; and Fund staff estimates and projections. | ||||||||
Appendix: Change in the Calculation Methodology for the Short-Term External Debt
Tunisia's short-term external liabilities, as presented by the authorities and in line with IMF standards, include short-term financial and commercial liabilities.
During the 2004 Article IV consultations, IMF staff drew the authorities' attention to the inconsistency between the level of short-term commercial liabilities presented by the authorities and short-term external flows recorded in receipts in the balance of payments. The inconsistency stemmed from the fact that the stock of short-term commercial liabilities was the same as the flows recorded in the balance of payments (see table). The IMF staff asked the BCT to review these statistics and decided to exclude short-term commercial liabilities from Tunisia's short-term external debt in the report on the 2004 Article IV Consultations, with a note to that effect.
The discussions between IMF and BCT staff during the ROSC-Data Module mission led to agreement on the need to change the methodology for the calculation of short-term commercial liabilities. The level of short-term commercial liabilities should represent a certain percentage of imports that is more or less constant over time (e.g., 12 percent in 2004 - see table). As imports take place using short-term import credits (1-4 months), at the end of each year a stock of 1-4 months of imports is carried over to the following year. During 1-4 months of the following year, these liabilities are repaid but additional liabilities are contracted and at the end of the year there is a new carry-over to the following year corresponding to 1-4 months of imports, and so forth. The stock of these liabilities increases with the level of imports while remaining at a more or less constant percentage of imports over time. This is the new methodology. It is not possible, for example, to have a negative stock of short-term commercial liabilities, as shown in 2004 according to the old statistics (see table).
| Tunisia: Short-term Commercial External Liabilities:Stocks and Flows (TD millions, unless otherwise indicated) | ||||
|
|
2001 | 2002 | 2003 | 2004 |
|
Old BCT statistics |
||||
|
Balance of payments |
||||
|
Flows of short-term commercial liabilities (receipts) |
260.8 |
70.0 |
128.9 |
(150.5) |
|
Short-term external debt |
||||
Commercial liabilities |
260.8 |
70.0 |
128.9 |
(150.5) |
|
Idem (in % of imports of goods) |
1.9 |
0.5 |
0.9 |
(0.9) |
|
Idem (in % of GDP) |
0.9 |
0.2 |
0.4 |
(0.4) |
|
BCT statistics using the new methodology |
||||
|
Balance of payments |
||||
|
Flows of short-term commercial liabilities (receipts) |
260.8 |
70.0 |
128.9 |
(150.5) |
|
Short-term external debt |
||||
|
Commercial liabilities |
1,861.0 |
1,932.0 |
2,061.0 |
1,910.0 |
|
Idem (in % of imports of goods) |
13.6 |
14.3 |
14.7 |
12.0 |
|
Idem (in % of GDP) |
6.5 |
6.5 |
6.4 |
5.5 |
|
Impact on short-term commercial liablilities (% of GDP) |
5.6 | 6.2 | 6.0 | 5.9 |
1 See Appendix.
2 The strategy is aimed at liberalization of the capital account in three phases (see Tunisia-Staff Report for the 2004 Article IV Consultation, www.imf.org/external/country/TUN/index.htm).
IMF EXTERNAL RELATIONS DEPARTMENT
| Public Affairs | Media Relations | |||
|---|---|---|---|---|
| E-mail: | publicaffairs@imf.org | E-mail: | media@imf.org | |
| Fax: | 202-623-6220 | Phone: | 202-623-7100 | |